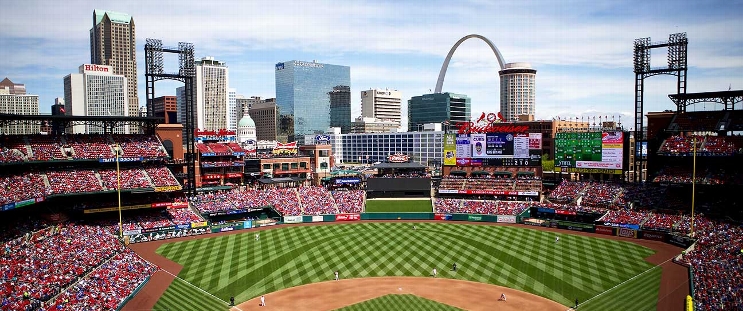
Boston Red Sox at St. Louis Cardinals
· Major League Baseball
6 - 10

Nootbaar, Winn hit 2-run homers, Cardinals drop Red Sox below .500 with 10-6 win
Nolan Arenado had three hits that included an RBI single in the eighth after entering in a 3-for-27 slide.
“I think today we were just locked in on just competing and we were in it,” Arenado said.
Nolan Gorman and Alec Burleson also went deep for the Cardinals, who matched season highs for runs, hits (14) and homers. St. Louis has had at least 10 hits in five of its last six games.
“A lot of good at-bats tonight from everybody, you know, and stringing them together as well,” Burleson said. “Just, you know, singled them to death when we needed to and then, you know, had a couple of long balls mixed in there too. So, a lot of fun to watch when we’re clicking.”
Winn’s two-run homer off Cam Booser was the first home run of Winn’s big league career.
“He came up to me right before that at bat, he said I’m going to be taking some big swings,” Nootbaar said. “And I was like, do it, dude, why not?”
Boston has lost three straight and 10 of 14, falling to 22-23. The Red Sox had not been under .500 since a 1-2 start.
Kyle Gibson (3-2) allowed five runs, eight hits and three walks in six-plus innings as the Cardinals won for the fourth time in five games.
Brayan Bello (4-2) gave up a season-high five runs in a season-low 4 2/3 innings. Pitching on his 25th birthday, he tied a career-worst by allowing three homers.
“It was a bad outing,” Bello said through an interpreter. “The team did everything possible to score some runs, to get me some run support, but I wasn’t able to make the adjustment tonight.”
Nootbaar put the Cardinals ahead when he drove a changeup 430 feet over the center-field wall for his third home run in 10 days.
“Hitting’s contagious and you have handful of guys that have some knocks and all of a sudden you feel a little bit better about yourself and have more confidence,” Nootbaar said.
David Hamilton’s two-run triple tied the score in the second. Tyler O’Neill scored on the hit and received a standing ovation in his return to St. Louis, his team from 2018-23.
Gorman homered in the second and Rafael Devers tied the score 3-3 with a 443-foot drive in the third — he is 9 for 20 against Gibson with three extra-base hits.
“We were what, 3 for 12 with runners in scoring position?” Red Sox manager Alex Cora said. “But the at-bats are getting better, which is, you know, a positive.”
Burleson homered leading off the fourth and Paul Goldschmidt hit an RBI single for a 5-3 lead in the fifth.
“Today was fun, man,” Cardinals manager Oliver Marmol said. “Up and down the lineup, not a whole lot of breathing room. Extra-base hits, homers, some key hits when they were needed from just about everybody. So, offense looked really really good today.”
TRAINER’S ROOM
Red Sox: RHP Garrett Whitlock (left oblique strain) experienced soreness in his right elbow following a rehab start and has been shut down. Whitlock, who threw 4 2/3 scoreless innings at Triple-A Worcester on Wednesday, returned to Boston and will undergo imaging tests over the weekend.
Cardinals: C Willson Contreras (left forearm fracture) had his cast removed and still hopes to return around the All-Star break. … RHP Giovanny Gallegos (right shoulder impingement) threw a bullpen session.
UP NEXT
The Cardinals will start RHP Miles Mikolas (3-5, 6.19 ERA) against RHP Kutter Crawford (2-2, 2.24 ERA) and the Red Sox on Saturday night. Mikolas allowed just one run in six innings in his lone career start last year against Boston. Crawford gave up four runs in four innings in his only career start against St. Louis in 2022.
How can I watch Boston Red Sox vs. St. Louis Cardinals?
- TV Channel: Red Sox at Cardinals 2022 MLB Baseball, is broadcasted on NESN.
- Online streaming: Sign up for Fubo.
Matchup Prediction
Scoring Summary
 |
9th Inning | O'Neill lined out to center. |
 |
9th Inning | Devers grounded into fielder's choice to pitcher, Refsnyder scored, Wong out at second. |
 |
9th Inning | Wong singled to center, Refsnyder to third. |
 |
9th Inning | Refsnyder reached on infield single to pitcher, Refsnyder safe at second on throwing error by pitcher King. |
 |
9th Inning | Duran grounded out to pitcher. |
 |
9th Inning | King relieved Kittredge |
Statistics
 BOS BOS |
 STL STL |
|
|---|---|---|
| 1 | Games Played | 1 |
| 1 | Team Games Played | 1 |
| 0 | Hit By Pitch | 0 |
| 21 | Ground Balls | 12 |
| 4 | Strikeouts | 6 |
| 6 | Runs Batted In | 10 |
| 0 | Sacrifice Hit | 0 |
| 12 | Hits | 14 |
| 1 | Stolen Bases | 0 |
| 4 | Walks | 3 |
| 0 | Catcher Interference | 0 |
| 6 | Runs | 10 |
| 2 | Ground Into Double Play | 1 |
| 0 | Sacrifice Flies | 0 |
| 37 | At Bats | 38 |
| 1 | Home Runs | 4 |
| 0 | Grand Slam Home Runs | 0 |
| 19 | Runners Left On Base | 14 |
| 1 | Triples | 0 |
| 0 | Game Winning RBIs | 1 |
| 0 | Intentional Walks | 0 |
| 3 | Doubles | 2 |
| 12 | Fly Balls | 20 |
| 0 | Caught Stealing | 0 |
| 143 | Pitches | 187 |
| 0 | Games Started | 0 |
| 1 | Pinch At Bats | 0 |
| 0 | Pinch Hits | 0 |
| 0.0 | Player Rating | 0.0 |
| 1 | Is Qualified | 1 |
| 1 | Is Qualified In Steals | 0 |
| 20 | Total Bases | 28 |
| 41 | Plate Appearances | 41 |
| 162.0 | Projected Home Runs | 648.0 |
| 5 | Extra Base Hits | 6 |
| 7.1 | Runs Created | 10.1 |
| .324 | Batting Average | .368 |
| .000 | Pinch Hit Average | .000 |
| .541 | Slugging Percentage | .737 |
| .351 | Secondary Average | .447 |
| .390 | On Base Percentage | .415 |
| .931 | OBP Pct + SLG Pct | 1.151 |
| 1.8 | Ground To Fly Ball Ratio | 0.6 |
| 7.1 | Runs Created Per 27 Outs | 10.9 |
| 48.5 | Batter Rating | 70.0 |
| 37.0 | At Bats Per Home Run | 9.5 |
| 1.00 | Stolen Base Percentage | 0.00 |
| 3.49 | Pitches Per Plate Appearance | 4.56 |
| .216 | Isolated Power | .368 |
| 1.00 | Walk To Strikeout Ratio | 0.50 |
| .098 | Walks Per Plate Appearance | .073 |
| .027 | Secondary Average Minus Batting Average | .079 |
| 12.0 | Runs Produced | 20.0 |
| 1.0 | Runs Ratio | 1.0 |
| 0.6 | Patience Ratio | 0.8 |
| 0.3 | Balls In Play Average | 0.4 |
| 97.0 | MLB Rating | 114.3 |
| 0.0 | Offensive Wins Above Replacement | 0.0 |
| 0.0 | Wins Above Replacement | 0.0 |
Game Information

Location: St. Louis, Missouri
Attendance: 37,961 | Capacity:
2024 American League East Standings
| TEAM | W | L | PCT | GB | STRK |
|---|---|---|---|---|---|
 New York New York |
- | 68 | W1 | 0.5802469 | 94 |
 Baltimore Baltimore |
3 | 71 | W3 | 0.5617284 | 91 |
 Boston Boston |
13 | 81 | W1 | 0.5 | 81 |
 Tampa Bay Tampa Bay |
14 | 82 | L1 | 0.49382716 | 80 |
 Toronto Toronto |
20 | 88 | L3 | 0.45679012 | 74 |
2024 National League Central Standings
| TEAM | W | L | PCT | GB | STRK |
|---|---|---|---|---|---|
 Milwaukee Milwaukee |
- | 69 | L1 | 0.5740741 | 93 |
 St. Louis St. Louis |
10 | 79 | W1 | 0.5123457 | 83 |
 Chicago Chicago |
10 | 79 | L1 | 0.5123457 | 83 |
 Cincinnati Cincinnati |
16 | 85 | W1 | 0.47530866 | 77 |
 Pittsburgh Pittsburgh |
17 | 86 | L1 | 0.4691358 | 76 |