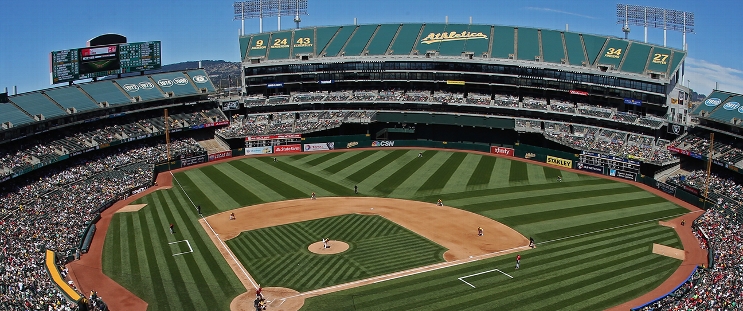
Toronto Blue Jays at Oakland Athletics
· Major League Baseball
7 - 0

Kevin Gausman throws the first shutout of his 12-year career as Blue Jays beat A's 7-0
A two-time All-Star who had never thrown a nine-inning complete game in the majors, the 33-year-old Gausman matched his season high of 10 strikeouts and walked one. The right-hander threw 109 pitches, his fourth time this season topping the century mark.
“It’s always good to give the bullpen a day off,” Gausman said. “You don’t see many (shutouts) anymore, so to get the first one in my career 10 years later after it started makes it that much more special.”
Gausman (5-4) allowed one run or fewer for the eighth time in 13 starts this season. His only previous complete game — on July 13, 2014 for Baltimore against the New York Yankees — was shortened to five innings because of rain.
Kevin Kiermaier homered and Danny Jansen drove in two runs for Toronto.
The A’s (26-40), who have lost seven of 10, were shut out for second time in three days and seventh overall this season.
“When you’re throwing the fastball at the bottom of the zone with the split that (Gausman) has, it makes it tough,” A’s manager Mark Kotsay said. “You don’t want to swing at the ball down but then again, you’ve got to protect the bottom half of the zone with the fastball, so he played his pitches really well. And obviously, the result was probably (the) best performance of his career.”
The Blue Jays did something they hadn’t done in 29 consecutive games dating to May 4 — score in the first inning. And they did it without getting a hit.
After A’s starter Luis Medina issued three consecutive one-out walks, Danny Jansen drove in Spencer Horwitz with a sacrifice fly.
Gausman, who pitched two seasons across the San Francisco Bay for the Giants, retired the side in order in three of the first six innings.
He worked out of a one-out, two-on jam in the seventh by getting Shea Langeliers to fly out and striking out Tyler Soderstrom looking.
With Gausman’s pitch count at 97 after eight innings, Toronto manager John Schneider had Zach Pop warming up for the ninth before opting to stick with his starter.
“I kind of have the old-school mentality where if I get through seven, let me go,” Gausman said. “I’ll go to 120 (pitches) if you need me to. But that’s not the game anymore. Relievers now are so good that you kind of almost want to give the ball to them.”
Gausman’s dominance made it an easy decision to leave him in.
“Split was really good and carrying the zone for most of the day,” Schneider said. “Fastball up, fastball down. He was just on. They were aggressive, and it kept his pitch count down.”
Toronto batted around in a five-run fifth inning.
After Kiermaier homered leading off the frame, Vladimir Guerrero, Bo Bichette and Jansen hit consecutive two-out doubles. Daniel Vogelbach scored on a wild pitch and Isiah Kiner-Falefa added an RBI single.
Justin Turner singled in a run for Toronto in the ninth.
“I thought there were pretty good at-bats up and down,” Schneider said. “We took our walks and we hit some balls hard. Just all-around a pretty complete game.”
Medina (0-1) allowed six runs and five hits in 4 2/3 innings in his second start since coming off the injured list. He walked five and struck out one.
TRAINER’S ROOM
Blue Jays: Horwitz was hitless in two at-bats but walked and scored in his season debut. One of the Blue Jays’ top prospects, Horwitz was called up from the minors on Friday.
UP NEXT
Athletics RHP Mitch Spence (4-3, 3.86 ERA) pitches the series finale on Sunday. The Blue Jays had not named a starter.
How can I watch Toronto Blue Jays vs. Oakland Athletics?
- TV Channel: Blue Jays at Athletics 2022 MLB Baseball, is broadcasted on MLB.tv.
- Online streaming: Sign up for Fubo.
Matchup Prediction
Scoring Summary
 |
9th Inning | Brown flied out to right. |
 |
9th Inning | Cameron grounded out to second. |
 |
9th Inning | Rooker flied out to right. |
 |
9th Inning | Kiermaier lined out to second. |
 |
9th Inning | Kiner-Falefa walked, Turner to second, Jansen to third. |
 |
9th Inning | Varsho struck out swinging. |
Statistics
 TOR TOR |
 OAK OAK |
|
|---|---|---|
| 1 | Games Played | 1 |
| 1 | Team Games Played | 1 |
| 0 | Hit By Pitch | 0 |
| 10 | Ground Balls | 8 |
| 3 | Strikeouts | 10 |
| 6 | Runs Batted In | 0 |
| 0 | Sacrifice Hit | 0 |
| 10 | Hits | 5 |
| 1 | Stolen Bases | 1 |
| 8 | Walks | 1 |
| 0 | Catcher Interference | 0 |
| 7 | Runs | 0 |
| 0 | Ground Into Double Play | 1 |
| 1 | Sacrifice Flies | 0 |
| 36 | At Bats | 31 |
| 1 | Home Runs | 0 |
| 0 | Grand Slam Home Runs | 0 |
| 16 | Runners Left On Base | 10 |
| 0 | Triples | 0 |
| 1 | Game Winning RBIs | 0 |
| 0 | Intentional Walks | 0 |
| 5 | Doubles | 0 |
| 24 | Fly Balls | 13 |
| 0 | Caught Stealing | 0 |
| 162 | Pitches | 109 |
| 0 | Games Started | 0 |
| 2 | Pinch At Bats | 0 |
| 1 | Pinch Hits | 0 |
| 0.0 | Player Rating | 0.0 |
| 1 | Is Qualified | 1 |
| 1 | Is Qualified In Steals | 1 |
| 18 | Total Bases | 5 |
| 45 | Plate Appearances | 32 |
| 162.0 | Projected Home Runs | 0.0 |
| 6 | Extra Base Hits | 0 |
| 8.1 | Runs Created | 0.1 |
| .278 | Batting Average | .161 |
| .500 | Pinch Hit Average | .000 |
| .500 | Slugging Percentage | .161 |
| .472 | Secondary Average | .065 |
| .400 | On Base Percentage | .188 |
| .900 | OBP Pct + SLG Pct | .349 |
| 0.4 | Ground To Fly Ball Ratio | 0.6 |
| 8.1 | Runs Created Per 27 Outs | 0.1 |
| 50.0 | Batter Rating | 6.0 |
| 36.0 | At Bats Per Home Run | 0.0 |
| 1.00 | Stolen Base Percentage | 1.00 |
| 3.60 | Pitches Per Plate Appearance | 3.41 |
| .222 | Isolated Power | .000 |
| 2.67 | Walk To Strikeout Ratio | 0.10 |
| .178 | Walks Per Plate Appearance | .031 |
| .194 | Secondary Average Minus Batting Average | -.097 |
| 13.0 | Runs Produced | 0.0 |
| 0.9 | Runs Ratio | 0.0 |
| 0.6 | Patience Ratio | 0.2 |
| 0.3 | Balls In Play Average | 0.2 |
| 95.3 | MLB Rating | 60.5 |
| 0.0 | Offensive Wins Above Replacement | 0.0 |
| 0.0 | Wins Above Replacement | 0.0 |
Game Information

Location: Oakland, California
Attendance: 9,285 | Capacity:
2024 American League East Standings
| TEAM | W | L | PCT | GB | STRK |
|---|---|---|---|---|---|
 New York New York |
- | 68 | W1 | 0.5802469 | 94 |
 Baltimore Baltimore |
3 | 71 | W3 | 0.5617284 | 91 |
 Boston Boston |
13 | 81 | W1 | 0.5 | 81 |
 Tampa Bay Tampa Bay |
14 | 82 | L1 | 0.49382716 | 80 |
 Toronto Toronto |
20 | 88 | L3 | 0.45679012 | 74 |
2024 American League West Standings
| TEAM | W | L | PCT | GB | STRK |
|---|---|---|---|---|---|
 Houston Houston |
- | 73 | W2 | 0.54658383 | 88 |
 Seattle Seattle |
3.5 | 77 | W4 | 0.52469134 | 85 |
 Texas Texas |
10.5 | 84 | W3 | 0.4814815 | 78 |
 Oakland Oakland |
19.5 | 93 | L3 | 0.42592594 | 69 |
 Los Angeles Los Angeles |
25.5 | 99 | L6 | 0.3888889 | 63 |