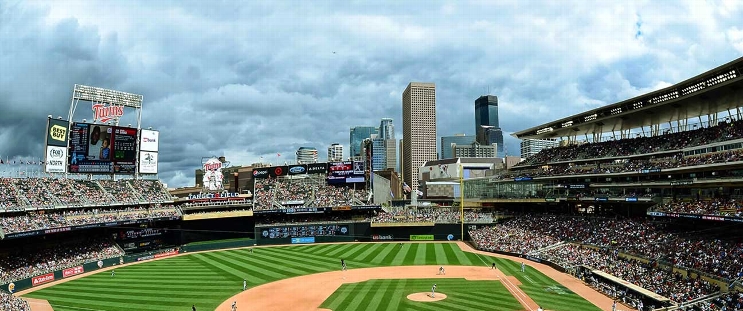
Tampa Bay Rays at Minnesota Twins
· Major League Baseball
3 - 2

Rays stop Twins' winning streak at 6 with 3-2 victory, after Royce Lewis' 10th-inning throwing error
The Rays, who improved to a major league -best 25-11 in games decided by one or two runs, won for just the fourth time in their last 12 games.
“Didn't really knock the cover off the ball, but we found a way to score there at the end,” Rays manager Kevin Cash said, praising Arozarena for his stolen base that put him in scoring position. “Late in the game, those plays are crucial in the moment.”
Jason Adam (4-1) pitched a perfect ninth for the victory. Phil Maton worked a 1-2-3 inning in the 10th for his second save, with closer Pete Fairbanks unavailable.
Jorge Alcala (1-2) hit Arozarena with a pitch to start the inning. He threw a sinker in the dirt so wildly it ricocheted off the backstop and right to catcher Christian Vázquez for a relatively easy throw-out of automatic runner Jose Siri at third.
Lewis, who had an otherwise-stellar night in the field and at the plate, fielded a sharp chopper by Jonny DeLuca to his left and sent his deep throw sailing past first baseman Carlos Santana that allowed Arozarena to race home.
“Out of the hand, it just cut. That’s all I’ve got for you," Lewis said. "I wouldn’t do anything different about that play. I set my feet and made the best throw I could.”
Lewis went 3 for 4 with a walk and a tiebreaking home run in the fifth inning that broke part of a videoboard at Target Field.
Isaac Paredes hit his team-leading 11th home run in the third off Twins starter Joe Ryan, who sailed through six innings with a 2-1 lead before a bumpy performance by the bullpen. Ryan delivered another bid to make his first All-Star team, allowing one run on six hits and one walk.
Ryan, who was selected in the seventh round by the Rays in the same 2018 draft that fetched Bradley in the fifth round, was traded to the Twins in 2021 for 55 games of veteran slugger Nelson Cruz. The Rays lost in the division series of the playoffs about 2 1/2 months later.
Rays starter Taj Bradley gave up two runs and seven hits with two walks in six innings.
Lewis hit his eighth homer in 14 games this season. He recently returned from a severely strained quadriceps muscle suffered in the season opener. With an exit velocity measured at 108.7 mph, this one ricocheted off the ribbon board that fronts the second deck above left field — and appeared to knock out a long section of LED lights that used to depict the rotating advertisements. The red Budweiser logos that were up at the time wound up with a blank black splotch, as did the rest that followed.
In 90 career major league games including the playoffs, Lewis has hit 29 homers with 74 RBI.
“I keep saying it: ‘More to come,’” Twins manager Rocco Baldelli said.
Yandy Diaz tied the game in the seventh with the softest of singles, a swinging bunt of sorts that dribbled down the third-base line where Lewis had no play. The Rays pieced that run together with a bloop single, a stolen base and an error on shortstop Carlos Correa when the throw bounced out of his glove and into center field to put Jose Caballero at third.
“It was an odd game,” Cash said. “Glad that we pulled it out. Lot of good things.”
TRAINER'S ROOM
Fairbanks played catch without any problems before the game, after the thumb on his throwing hand was bruised by a comebacker on Tuesday. He said he expects to be available by Thursday.
UP NEXT
The Rays will send RHP Zack Littell (2-5, 4.24 ERA) to the mound for the series finale on Thursday afternoon, opposite Twins rookie RHP Simeon Woods Richardson (2-1, 3.29 ERA).
How can I watch Tampa Bay Rays vs. Minnesota Twins?
- TV Channel: Rays at Twins 2022 MLB Baseball, is broadcasted on MLB.tv.
- Online streaming: Sign up for Fubo.
Matchup Prediction
Scoring Summary
 |
10th Inning | Correa flied out to left. |
 |
10th Inning | Kepler struck out swinging. |
 |
10th Inning | Lewis grounded out to third. |
 |
10th Inning | Maton relieved Adam |
 |
10th Inning | Margot ran for Miranda |
 |
10th Inning | Caballero grounded out to shortstop. |
Statistics
 TB TB |
 MIN MIN |
|
|---|---|---|
| 1 | Games Played | 1 |
| 1 | Team Games Played | 1 |
| 1 | Hit By Pitch | 0 |
| 12 | Ground Balls | 13 |
| 7 | Strikeouts | 7 |
| 2 | Runs Batted In | 1 |
| 0 | Sacrifice Hit | 0 |
| 8 | Hits | 9 |
| 4 | Stolen Bases | 0 |
| 6 | Walks | 3 |
| 0 | Catcher Interference | 0 |
| 3 | Runs | 2 |
| 1 | Ground Into Double Play | 1 |
| 0 | Sacrifice Flies | 0 |
| 37 | At Bats | 38 |
| 1 | Home Runs | 1 |
| 0 | Grand Slam Home Runs | 0 |
| 24 | Runners Left On Base | 18 |
| 0 | Triples | 0 |
| 0 | Game Winning RBIs | 0 |
| 0 | Intentional Walks | 1 |
| 2 | Doubles | 2 |
| 18 | Fly Balls | 18 |
| 0 | Caught Stealing | 0 |
| 198 | Pitches | 152 |
| 0 | Games Started | 0 |
| 2 | Pinch At Bats | 1 |
| 0 | Pinch Hits | 0 |
| 0.0 | Player Rating | 0.0 |
| 1 | Is Qualified | 1 |
| 1 | Is Qualified In Steals | 0 |
| 13 | Total Bases | 14 |
| 44 | Plate Appearances | 41 |
| 162.0 | Projected Home Runs | 162.0 |
| 3 | Extra Base Hits | 3 |
| 5.5 | Runs Created | 3.9 |
| .216 | Batting Average | .237 |
| .000 | Pinch Hit Average | .000 |
| .351 | Slugging Percentage | .368 |
| .405 | Secondary Average | .211 |
| .341 | On Base Percentage | .293 |
| .692 | OBP Pct + SLG Pct | .661 |
| 0.7 | Ground To Fly Ball Ratio | 0.7 |
| 4.9 | Runs Created Per 27 Outs | 3.5 |
| 29.0 | Batter Rating | 22.0 |
| 37.0 | At Bats Per Home Run | 38.0 |
| 1.00 | Stolen Base Percentage | 0.00 |
| 4.50 | Pitches Per Plate Appearance | 3.71 |
| .135 | Isolated Power | .132 |
| 0.86 | Walk To Strikeout Ratio | 0.43 |
| .136 | Walks Per Plate Appearance | .073 |
| .189 | Secondary Average Minus Batting Average | -.026 |
| 5.0 | Runs Produced | 3.0 |
| 0.7 | Runs Ratio | 0.5 |
| 0.5 | Patience Ratio | 0.4 |
| 0.2 | Balls In Play Average | 0.3 |
| 78.8 | MLB Rating | 76.8 |
| 0.0 | Offensive Wins Above Replacement | 0.0 |
| 0.0 | Wins Above Replacement | 0.0 |
Game Information

Location: Minneapolis, Minnesota
Attendance: 20,712 | Capacity:
2024 American League East Standings
| TEAM | W | L | PCT | GB | STRK |
|---|---|---|---|---|---|
 New York New York |
- | 68 | W1 | 0.5802469 | 94 |
 Baltimore Baltimore |
3 | 71 | W3 | 0.5617284 | 91 |
 Boston Boston |
13 | 81 | W1 | 0.5 | 81 |
 Tampa Bay Tampa Bay |
14 | 82 | L1 | 0.49382716 | 80 |
 Toronto Toronto |
20 | 88 | L3 | 0.45679012 | 74 |
2024 American League Central Standings
| TEAM | W | L | PCT | GB | STRK |
|---|---|---|---|---|---|
 Cleveland Cleveland |
- | 69 | L2 | 0.5714286 | 92 |
 Kansas City Kansas City |
6.5 | 76 | W1 | 0.5308642 | 86 |
 Detroit Detroit |
6.5 | 76 | L2 | 0.5308642 | 86 |
 Minnesota Minnesota |
10.5 | 80 | L4 | 0.50617284 | 82 |
 Chicago Chicago |
51.5 | 121 | W2 | 0.25308642 | 41 |