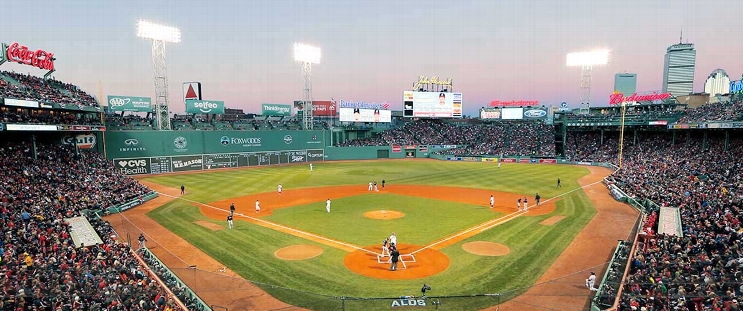
San Diego Padres at Boston Red Sox
· Major League Baseball
1 - 4

Rafael Devers hits 2-run homer, Red Sox end Padres' 5-game win streak with 4-1 victory
The Red Sox, who were outscored 20-3 in the series' first two games, snapped a three-game skid.
Jackson Merrill had three hits for the Padres, and Ha-Seong Kim added an RBI double. San Diego had won nine of its previous 10 games.
Making his first start since being recalled from Triple-A on Tuesday, Boston right-hander Josh Winckowski (2-1) gave up four hits over five scoreless innings.
“I kind of figured out something a little bit down in Triple-A,” he said. “I was throwing changeups that were literally just like a ball down and almost never, ever getting swings on it, so we just started throwing it in the zone all times and it turned into a high-percentage strike pitch for me and I got a lot of ground balls.”
Kenley Jansen, the fourth reliever, got the final three outs for his 16th save this season and 436th of his career.
Padres starter Matt Waldron (5-7) gave up four runs, three earned, in 4 1/3 innings, halting his NL-high stretch this season of nine consecutive starts allowing two or fewer runs.
Waldron, the only pitcher to throw a knuckleball in the majors this year, mixed it with his fastball and sweeper at Fenway Park, where former Red Sox right-hander Tim Wakefield famously threw the pitch during his 17-year career with Boston.
Wakefield died last October at age 57 after a battle with brain cancer. Waldron, who was inspired as a child by Wakefield to learn the knuckleball, threw it for his first pitch on Sunday.
“I know that Wakefield has toed that rubber,” Waldron said, becoming emotional. “You could feel it. It was tough. At the end of the day, I've got to get a job done and that just didn't happen.”
Devers drove a fastball into the second row of Monster seats for his 18th homer, making it 2-0 in the first.
“A few knuckleballs and a few fastballs they were able to put some barrels on,” Padres manager Mike Shildt said. “But overall, I thought he was good. He usually gets better as the game goes on. ... They had a good plan and didn't miss it.”
In the third, Wilyer Abreu singled with two outs, advanced to third on a single and scored when catcher Kyle Higashioka couldn’t handle Waldron’s knuckleball for a passed ball, his first of two.
Duran’s ninth homer of the season came off a knuckleball and hooked around the Pesky Pole in right field to make it 4-0 in the fifth.
“I'm so glad he threw it the first pitch of the game so I could see what it looks like,” Duran said. “That thing is nasty. Kind of the game plan for me was just to, honestly, see it above my eyeballs, because if it's up there I'm hoping its not going to move as much as if it was down.”
The last few innings were played under dark skies with thunder rumbling at times in the distance, with flashes of lightning bringing reaction from the crowd.
Seconds after lightning flashed, San Diego’s Manny Machado grounded out to end a scoreless fifth, something the Red Sox were glad to see after giving up nine runs in that inning on Friday and six on Saturday.
It was the first time since 2013 that the clubs met at Fenway.
UP NEXT
Padres: Open a three-game series at Texas on Tuesday. San Diego hadn't announced a starter. RHP Nathan Eovaldi (4-3, 3.45 ERA) is set to pitch for the Rangers.
Red Sox: RHP Kutter Crawford (3-7, 3.59) is in line to start Tuesday in the first of three games against Miami. RHP Valente Bellozo (0-0, 0.00) is scheduled for the Marlins.
How can I watch San Diego Padres vs. Boston Red Sox?
- TV Channel: Padres at Red Sox 2022 MLB Baseball, is broadcasted on NESN.
- Online streaming: Sign up for Fubo.
Matchup Prediction
Scoring Summary
 |
9th Inning | Kim lined out to center. |
 |
9th Inning | Merrill struck out swinging. |
 |
9th Inning | Solano flied out to right. |
 |
9th Inning | Jansen relieved Martin |
 |
8th Inning | Smith flied out to center. |
 |
8th Inning | Yoshida lined out to center. |
Statistics
 SD SD |
 BOS BOS |
|
|---|---|---|
| 1 | Games Played | 1 |
| 1 | Team Games Played | 1 |
| 1 | Hit By Pitch | 0 |
| 17 | Ground Balls | 10 |
| 4 | Strikeouts | 5 |
| 1 | Runs Batted In | 3 |
| 1 | Sacrifice Hit | 0 |
| 8 | Hits | 8 |
| 0 | Stolen Bases | 0 |
| 0 | Walks | 3 |
| 0 | Catcher Interference | 0 |
| 1 | Runs | 4 |
| 2 | Ground Into Double Play | 1 |
| 0 | Sacrifice Flies | 0 |
| 32 | At Bats | 31 |
| 0 | Home Runs | 2 |
| 0 | Grand Slam Home Runs | 0 |
| 16 | Runners Left On Base | 13 |
| 0 | Triples | 0 |
| 0 | Game Winning RBIs | 1 |
| 0 | Intentional Walks | 0 |
| 2 | Doubles | 1 |
| 12 | Fly Balls | 16 |
| 0 | Caught Stealing | 0 |
| 112 | Pitches | 134 |
| 0 | Games Started | 0 |
| 1 | Pinch At Bats | 1 |
| 0 | Pinch Hits | 0 |
| 0.0 | Player Rating | 0.0 |
| 1 | Is Qualified | 1 |
| 0 | Is Qualified In Steals | 0 |
| 10 | Total Bases | 15 |
| 34 | Plate Appearances | 34 |
| 0.0 | Projected Home Runs | 324.0 |
| 2 | Extra Base Hits | 3 |
| 2.0 | Runs Created | 4.6 |
| .250 | Batting Average | .258 |
| .000 | Pinch Hit Average | .000 |
| .313 | Slugging Percentage | .484 |
| .063 | Secondary Average | .323 |
| .273 | On Base Percentage | .324 |
| .585 | OBP Pct + SLG Pct | .807 |
| 1.4 | Ground To Fly Ball Ratio | 0.6 |
| 2.0 | Runs Created Per 27 Outs | 5.2 |
| 16.0 | Batter Rating | 30.0 |
| 0.0 | At Bats Per Home Run | 15.5 |
| 0.00 | Stolen Base Percentage | 0.00 |
| 3.29 | Pitches Per Plate Appearance | 3.94 |
| .063 | Isolated Power | .226 |
| 0.00 | Walk To Strikeout Ratio | 0.60 |
| .000 | Walks Per Plate Appearance | .088 |
| -.188 | Secondary Average Minus Batting Average | .065 |
| 2.0 | Runs Produced | 7.0 |
| 1.0 | Runs Ratio | 0.8 |
| 0.3 | Patience Ratio | 0.5 |
| 0.3 | Balls In Play Average | 0.3 |
| 72.5 | MLB Rating | 82.8 |
| 0.0 | Offensive Wins Above Replacement | 0.0 |
| 0.0 | Wins Above Replacement | 0.0 |
Game Information

Location: Boston, Massachusetts
Attendance: 30,665 | Capacity:
2024 National League West Standings
| TEAM | W | L | PCT | GB | STRK |
|---|---|---|---|---|---|
 Los Angeles Los Angeles |
- | 64 | W5 | 0.60493827 | 98 |
 San Diego San Diego |
5 | 69 | L1 | 0.5740741 | 93 |
 Arizona Arizona |
9 | 73 | W1 | 0.5493827 | 89 |
 San Francisco San Francisco |
18 | 82 | L1 | 0.49382716 | 80 |
 Colorado Colorado |
37 | 101 | L3 | 0.37654322 | 61 |
2024 American League East Standings
| TEAM | W | L | PCT | GB | STRK |
|---|---|---|---|---|---|
 New York New York |
- | 68 | W1 | 0.5802469 | 94 |
 Baltimore Baltimore |
3 | 71 | W3 | 0.5617284 | 91 |
 Boston Boston |
13 | 81 | W1 | 0.5 | 81 |
 Tampa Bay Tampa Bay |
14 | 82 | L1 | 0.49382716 | 80 |
 Toronto Toronto |
20 | 88 | L3 | 0.45679012 | 74 |