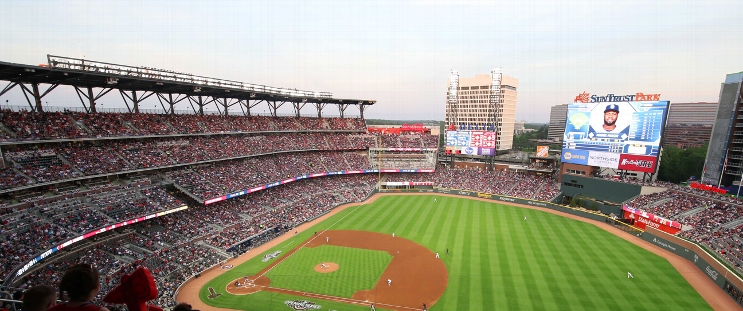
San Francisco Giants at Atlanta Braves
· Major League Baseball
1 - 3

Braves left-hander Chris Sale fans 9 in 6 innings and earns 11th win in 3-1 victory over Giants
Sale (11-3) tied Kansas City’s Seth Lugo for the most wins in the majors, confirming his return to his early career form of winning 11 or more games in seven consecutive seasons with the Chicago White Sox and Boston Red Sox.
“Is that more wins than I've gotten in the last five years combined?” Sale asked with a smile.
It is Sale’s most wins since finishing 12-4 in 2018 with Boston. The left-hander recorded nine strikeouts while allowing one run and positioned himself for All-Star consideration.
“We'll cross that bridge if it gets here,” Sale said when asked about the possibility of being named the NL starting pitcher. “... I would appreciate it but again we've got games to play. I don't want to be distracted.”
The Giants were held to four hits by Sale and three relievers.
Austin Riley hit a two-run double in the fifth.
Sale needed only six pitches to retire the Giants in order in the first, setting the stage for his strong start. The left-hander struck out the side in the third. Sale added two more strikeouts to open the fifth before Curt Casali lined a single to center field for San Francisco's first hit.
The Braves took a 1-0 lead on three consecutive hits, including Adam Duvall's run-scoring double off Jordan Hicks (4-5) to open the second. Duvall had three hits.
Hicks allowed three runs in five innings.
“It's not like he pitched poorly,” said Giants manager Bob Melvin of Hicks. “It came down to not solving Sale and then three pretty good relievers after that.”
Riley's two-run double off the right-field wall in the fifth stretched the lead to 3-0.
Home plate umpire Ryan Additon called Riley safe on his slide at the plate as he tried to score from second on Travis d'Arnaud's single to right field. The Giants challenged the call, and the replay showed Casali tagged Riley after catching the throw from right fielder Austin Slater.
Matt Chapman’s double drove in Jorge Soler in the sixth for the Giants’ only run.
Chapman reached on an infield single with one out in the ninth before Raisel Iglesias finished off his 21st save in 23 chances.
Giants left fielder Luis Matos made a diving catch of Riley's sinking liner to end the third.
TRAINER’S ROOM
Giants: Melvin says there is “a chance” LHP Kyle Harrison (right ankle sprain) could come off the injured list to start Saturday at Cleveland.
Braves: SS Orlando Arcia missed his second straight game after having an abscessed tooth removed. Manager Brian Snitker said Arcia had an infection and was being given protein drinks “just to get something in him.” ... OF Ramón Laureano (lower back soreness) says he is feeling better but Snitker said “it's not better enough to play. ... He can't run. Can't swing yet.” ... OF Michael Harris II (strained left hamstring) ran for the first time since landing on the injured list on June 16. ... Snitker managed to laugh after he was hit below his belt by a line-drive foul ball hit by Ozzie Albies in the fifth.
UP NEXT
Giants RHP Logan Webb (6-6, 3.12 ERA) will try to extend his record of strong pitching at Truist Park when he faces Braves RHP Charlie Morton (5-4, 3.89) in Thursday night's final game of the series. Webb is 2-0 with a 2.08 ERA in four career starts in Atlanta.
How can I watch San Francisco Giants vs. Atlanta Braves?
- TV Channel: Giants at Braves 2022 MLB Baseball, is broadcasted on MLB.tv.
- Online streaming: Sign up for Fubo.
Matchup Prediction
Scoring Summary
 |
9th Inning | Wisely struck out swinging. |
 |
9th Inning | Matos flied out to right. |
 |
9th Inning | Chapman reached on infield single to second. |
 |
9th Inning | Ramos grounded out to pitcher. |
 |
9th Inning | Iglesias relieved Jiménez |
 |
8th Inning | Wall flied out to left. |
Statistics
 SF SF |
 ATL ATL |
|
|---|---|---|
| 1 | Games Played | 1 |
| 1 | Team Games Played | 1 |
| 0 | Hit By Pitch | 0 |
| 9 | Ground Balls | 8 |
| 12 | Strikeouts | 11 |
| 1 | Runs Batted In | 3 |
| 0 | Sacrifice Hit | 0 |
| 4 | Hits | 10 |
| 0 | Stolen Bases | 1 |
| 2 | Walks | 2 |
| 0 | Catcher Interference | 0 |
| 1 | Runs | 3 |
| 0 | Ground Into Double Play | 0 |
| 0 | Sacrifice Flies | 0 |
| 31 | At Bats | 33 |
| 0 | Home Runs | 0 |
| 0 | Grand Slam Home Runs | 0 |
| 11 | Runners Left On Base | 15 |
| 0 | Triples | 0 |
| 0 | Game Winning RBIs | 1 |
| 0 | Intentional Walks | 0 |
| 2 | Doubles | 2 |
| 10 | Fly Balls | 14 |
| 0 | Caught Stealing | 1 |
| 139 | Pitches | 133 |
| 0 | Games Started | 0 |
| 2 | Pinch At Bats | 0 |
| 0 | Pinch Hits | 0 |
| 0.0 | Player Rating | 0.0 |
| 1 | Is Qualified | 1 |
| 0 | Is Qualified In Steals | 1 |
| 6 | Total Bases | 12 |
| 33 | Plate Appearances | 35 |
| 0.0 | Projected Home Runs | 0.0 |
| 2 | Extra Base Hits | 2 |
| 0.5 | Runs Created | 4.0 |
| .129 | Batting Average | .303 |
| .000 | Pinch Hit Average | .000 |
| .194 | Slugging Percentage | .364 |
| .129 | Secondary Average | .121 |
| .182 | On Base Percentage | .343 |
| .375 | OBP Pct + SLG Pct | .706 |
| 0.9 | Ground To Fly Ball Ratio | 0.6 |
| 0.5 | Runs Created Per 27 Outs | 4.5 |
| 12.0 | Batter Rating | 27.0 |
| 0.0 | At Bats Per Home Run | 0.0 |
| 0.00 | Stolen Base Percentage | 0.50 |
| 4.21 | Pitches Per Plate Appearance | 3.80 |
| .065 | Isolated Power | .061 |
| 0.17 | Walk To Strikeout Ratio | 0.18 |
| .061 | Walks Per Plate Appearance | .057 |
| .000 | Secondary Average Minus Batting Average | -.182 |
| 2.0 | Runs Produced | 6.0 |
| 1.0 | Runs Ratio | 1.0 |
| 0.2 | Patience Ratio | 0.4 |
| 0.2 | Balls In Play Average | 0.5 |
| 61.8 | MLB Rating | 79.0 |
| 0.0 | Offensive Wins Above Replacement | 0.0 |
| 0.0 | Wins Above Replacement | 0.0 |
Game Information

Location: Atlanta, Georgia
Attendance: 38,834 | Capacity:
2024 National League West Standings
| TEAM | W | L | PCT | GB | STRK |
|---|---|---|---|---|---|
 Los Angeles Los Angeles |
- | 64 | W5 | 0.60493827 | 98 |
 San Diego San Diego |
5 | 69 | L1 | 0.5740741 | 93 |
 Arizona Arizona |
9 | 73 | W1 | 0.5493827 | 89 |
 San Francisco San Francisco |
18 | 82 | L1 | 0.49382716 | 80 |
 Colorado Colorado |
37 | 101 | L3 | 0.37654322 | 61 |
2024 National League East Standings
| TEAM | W | L | PCT | GB | STRK |
|---|---|---|---|---|---|
 Philadelphia Philadelphia |
- | 67 | W1 | 0.58641976 | 95 |
 Atlanta Atlanta |
6 | 73 | W1 | 0.5493827 | 89 |
 New York New York |
6 | 73 | L1 | 0.5493827 | 89 |
 Washington Washington |
24 | 91 | L1 | 0.4382716 | 71 |
 Miami Miami |
33 | 100 | W4 | 0.38271606 | 62 |