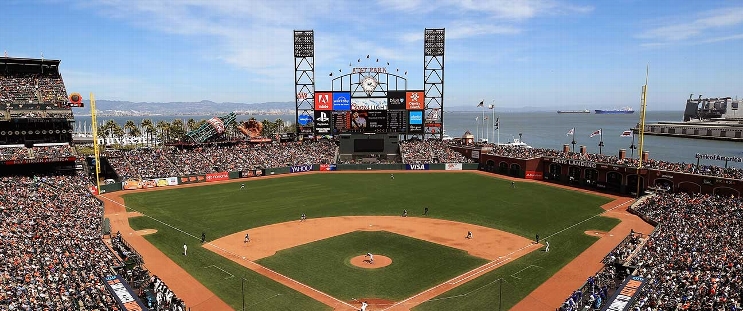
Toronto Blue Jays at San Francisco Giants
· Major League Baseball
10 - 6

Clement homers, drives in 4 to lead Blue Jays past Giants 10-6
Clement and Alejandro Kirk each had three hits, and George Springer drove in three runs as Toronto had its highest scoring total since a 14-11 loss at Detroit on May 26.
“It’s nice to score some runs for (the pitching staff) because they’ve picked us up all year,” Clement said. “We’ve got to start giving them some more support.”
Patrick Bailey and Matt Chapman hit back-to-back homers in the ninth for San Francisco.
Chris Bassitt (8-7) grinded through five innings, allowing three runs and five hits with six strikeouts and four walks to win for the fifth time in his last six decisions.
“I thought he used his breaking ball better as the game went and that was kind of the difference for him,” Blue Jays manager John Schneider said. “Man, that’s a gutsy effort by him.”
Giants All-Star Logan Webb (7-7) was charged with seven earned runs, matching a career high. He gave up eight hits and a walk with four strikeouts in five-plus innings, snapping a streak of 11 straight starts of at least six innings.
“This is the one real blip, this game, in his first half,” San Francisco manager Bob Melvin said. “Look, they’re going to happen sometimes. But proud of the fact that he's an All-Star.”
Michael Conforto and Thairo Estrada had RBI singles in the first inning to give the Giants a 2-0 lead.
Clement’s three-run shot in the fifth put the Blue Jays in front, and Conforto tied it in the bottom half with an RBI double.
Toronto began the sixth with six consecutive hits, including RBI singles by Justin Turner, Davis Schneider, Kirk and Clement. Springer capped the rally with a two-run double, and had an RBI double in the eighth.
“You’ve got to hit the mistakes, and that’s what we did,” Schneider said. “But I thought we stuck with a pretty good game plan and some really big hits.”
TRAINER’S ROOM
Blue Jays: SS Bo Bichette left the game in the fourth inning with right calf soreness and got an MRI after the game. “He wanted to stay in,” Schneider said. “He’s a gamer. I didn’t want to take a chance. ... (We'll) see how he is tomorrow.” ... LF Daulton Varsho exited in the third inning with a left knee contusion an inning after lunging awkwardly for first base trying to beat out a slow roller. Webb fielded the ball along the first base line and made a diving tag on Varsho, who remained in left field for the bottom of the second but was removed in the third. He is considered day-to-day. ... RHP Yimi García (nerve inflammation in pitching elbow) had his rehab outing with Triple-A Buffalo pushed back for a second straight day due to neck stiffness. “Hopefully he feels better tomorrow and he’s back in there,” Schneider said.
Giants: DH Jorge Soler missed his second straight game due to illness, but manager Bob Melvin expects him to return Thursday. ... RHP Alex Cobb (left hip surgery/right shoulder soreness) threw 55 pitches in a rehab start for Single-A San Jose on Wednesday, allowing three runs in four innings. ... LHP Robbie Ray (Tommy John surgery) threw 59 pitches in a rehab start for Single-A San Jose on Tuesday, permitting four runs in three innings. He will make his next rehab start for Triple-A Sacramento on Sunday or Monday.
UP NEXT
Blue Jays RHP Kevin Gausman (6-8, 4.64 ERA) returns to Oracle Park on Thursday for the first time since he was a member of the Giants from 2020-21. San Francisco counters with RHP Jordan Hicks (4-5, 3.47), who made 25 relief appearances for Toronto last season.
—-
How can I watch Toronto Blue Jays vs. San Francisco Giants?
- TV Channel: Blue Jays at Giants 2022 MLB Baseball, is broadcasted on MLB.tv.
- Online streaming: Sign up for Fubo.
Matchup Prediction
Scoring Summary
 |
9th Inning | Estrada struck out swinging. |
 |
9th Inning | Conforto flied out to center. |
 |
9th Inning | Chapman homered to left (389 feet). |
 |
9th Inning | Bailey homered to center (406 feet). |
 |
9th Inning | Ramos struck out swinging. |
 |
9th Inning | Francis relieved Burr |
Statistics
 TOR TOR |
 SF SF |
|
|---|---|---|
| 1 | Games Played | 1 |
| 1 | Team Games Played | 1 |
| 0 | Hit By Pitch | 0 |
| 21 | Ground Balls | 11 |
| 7 | Strikeouts | 9 |
| 10 | Runs Batted In | 6 |
| 0 | Sacrifice Hit | 0 |
| 14 | Hits | 9 |
| 0 | Stolen Bases | 0 |
| 1 | Walks | 6 |
| 0 | Catcher Interference | 0 |
| 10 | Runs | 6 |
| 0 | Ground Into Double Play | 0 |
| 0 | Sacrifice Flies | 0 |
| 41 | At Bats | 36 |
| 1 | Home Runs | 2 |
| 0 | Grand Slam Home Runs | 0 |
| 14 | Runners Left On Base | 13 |
| 0 | Triples | 0 |
| 1 | Game Winning RBIs | 0 |
| 0 | Intentional Walks | 0 |
| 4 | Doubles | 1 |
| 13 | Fly Balls | 16 |
| 0 | Caught Stealing | 0 |
| 133 | Pitches | 160 |
| 0 | Games Started | 0 |
| 0 | Pinch At Bats | 1 |
| 0 | Pinch Hits | 0 |
| 0.0 | Player Rating | 0.0 |
| 1 | Is Qualified | 1 |
| 0 | Is Qualified In Steals | 0 |
| 21 | Total Bases | 16 |
| 42 | Plate Appearances | 42 |
| 162.0 | Projected Home Runs | 324.0 |
| 5 | Extra Base Hits | 3 |
| 7.2 | Runs Created | 6.1 |
| .341 | Batting Average | .250 |
| .000 | Pinch Hit Average | .000 |
| .512 | Slugging Percentage | .444 |
| .195 | Secondary Average | .361 |
| .357 | On Base Percentage | .357 |
| .869 | OBP Pct + SLG Pct | .802 |
| 1.6 | Ground To Fly Ball Ratio | 0.7 |
| 7.2 | Runs Created Per 27 Outs | 6.1 |
| 65.0 | Batter Rating | 41.0 |
| 41.0 | At Bats Per Home Run | 18.0 |
| 0.00 | Stolen Base Percentage | 0.00 |
| 3.17 | Pitches Per Plate Appearance | 3.81 |
| .171 | Isolated Power | .194 |
| 0.14 | Walk To Strikeout Ratio | 0.67 |
| .024 | Walks Per Plate Appearance | .143 |
| -.146 | Secondary Average Minus Batting Average | .111 |
| 20.0 | Runs Produced | 12.0 |
| 1.0 | Runs Ratio | 1.0 |
| 0.5 | Patience Ratio | 0.6 |
| 0.4 | Balls In Play Average | 0.3 |
| 105.8 | MLB Rating | 88.5 |
| 0.0 | Offensive Wins Above Replacement | 0.0 |
| 0.0 | Wins Above Replacement | 0.0 |
Game Information

Location: San Francisco, California
Attendance: 32,014 | Capacity:
2024 American League East Standings
| TEAM | W | L | PCT | GB | STRK |
|---|---|---|---|---|---|
 New York New York |
- | 68 | W1 | 0.5802469 | 94 |
 Baltimore Baltimore |
3 | 71 | W3 | 0.5617284 | 91 |
 Boston Boston |
13 | 81 | W1 | 0.5 | 81 |
 Tampa Bay Tampa Bay |
14 | 82 | L1 | 0.49382716 | 80 |
 Toronto Toronto |
20 | 88 | L3 | 0.45679012 | 74 |
2024 National League West Standings
| TEAM | W | L | PCT | GB | STRK |
|---|---|---|---|---|---|
 Los Angeles Los Angeles |
- | 64 | W5 | 0.60493827 | 98 |
 San Diego San Diego |
5 | 69 | L1 | 0.5740741 | 93 |
 Arizona Arizona |
9 | 73 | W1 | 0.5493827 | 89 |
 San Francisco San Francisco |
18 | 82 | L1 | 0.49382716 | 80 |
 Colorado Colorado |
37 | 101 | L3 | 0.37654322 | 61 |