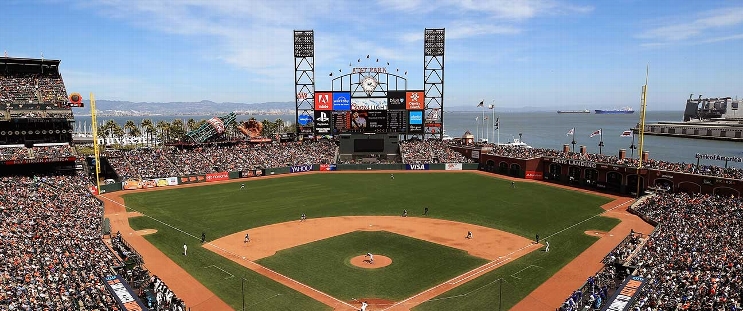
Toronto Blue Jays at San Francisco Giants
· Major League Baseball
5 - 3

Danny Jansen and Spencer Horwitz homer, Kevin Gausman pitches Blue Jays past Giants 5-3
Gausman (7-8) allowed two runs and six hits with three strikeouts and no walks in his first outing at Oracle Park since pitching for the Giants in 2020-21.
“Lots of special memories, for sure,” Gausman said. “Not many guys I know over there, but I really respect everybody over there a lot.”
Vladimir Guerrero Jr., Justin Turner and Leo Jiménez also drove in runs for Toronto, which took two of three from San Francisco and won for the fourth time in five games.
“I think that we’ve had some great at-bats of late,” Jansen said. “It’s contagious. Just feeding off each other and having an approach as a unit and going out there and hunting balls in the middle of the plate. That’s where the damage is. It was a great game. It was a good series with the bats.”
Toronto's Kevin Kiermaier had two hits and made a diving catch in center field to rob Matt Chapman of a hit in the fourth inning.
Heliot Ramos and Mike Yastrzemski homered for the Giants, who have lost four of five.
Jordan Hicks (4-6) lost his fifth straight decision, allowing five runs and eight hits with one strikeout and one walk in 4 1/3 innings against his former club. Hicks made 25 relief appearances for the Blue Jays last season.
“Just wasn’t great overall,” he said. “Not my best performance. ... I feel like four groundballs got through, besides the two homers. Those are big obviously, but just the groundballs getting through. It's unfortunate, but keep battling."
Jansen connected for his sixth homer to cap a three-run first inning for Toronto. It was his first longball since May 20.
“It definitely felt good,” Jansen said. “Been grinding definitely over the last however many weeks. But still just trying to have good at-bats and pass it on to the next guy. But to be able to square one up, it definitely felt good. Just gonna keep building off of it and keep going.”
Ramos answered with a two-run shot in the bottom half, his team-leading 14th of the season.
Jiménez singled home Davis Schneider in the fourth for his first career RBI, and Horwitz hit his fourth homer of the season in the fifth.
Yastrzemski hit his eighth homer off Chad Green with two outs in the ninth. Green recovered to strike out Wilmer Flores and earned his fifth save.
“It was a pretty complete effort,” Blue Jays manager John Schneider said. “I really like the way we came out day after night (game) in the first inning.”
TRAINER’S ROOM
Blue Jays: SS Bo Bichette was diagnosed with a right calf fascia strain after leaving Wednesday’s game in the fourth inning. Schneider said he was day-to-day but wouldn’t rule out a trip to the injured list. ... OF Daulton Varsho missed the game with a left knee contusion after exiting in the third inning Wednesday. He is considered day-to-day.
Giants: DH Jorge Soler went 1 for 4 after missing two games due to illness. ... 1B LaMonte Wade Jr. was held out with minor hamstring tightness. Manager Bob Melvin said he would likely play Friday.
UP NEXT
Blue Jays: RHP Yariel Rodríguez (1-3, 3.68 ERA) opens a three-game series at Arizona on Friday night opposite RHP Ryne Nelson (6-6, 5.08).
Giants: LHP Kyle Harrison (4-4, 4.24) tries to snap a three-game losing streak Friday night when San Francisco welcomes the Minnesota Twins for a three-game series. Minnesota counters with RHP Joe Ryan (6-5, 3.29).
How can I watch Toronto Blue Jays vs. San Francisco Giants?
- TV Channel: Blue Jays at Giants 2022 MLB Baseball, is broadcasted on MLB.tv.
- Online streaming: Sign up for Fubo.
Matchup Prediction
Scoring Summary
 |
9th Inning | Flores struck out swinging. |
 |
9th Inning | Yastrzemski homered to right (392 feet). |
 |
9th Inning | Chapman flied out to center. |
 |
9th Inning | Conforto grounded out to pitcher. |
 |
9th Inning | Green relieved Pop |
 |
9th Inning | Horwitz grounded into double play, third to second to first, Springer out at second. |
Statistics
 TOR TOR |
 SF SF |
|
|---|---|---|
| 1 | Games Played | 1 |
| 1 | Team Games Played | 1 |
| 1 | Hit By Pitch | 0 |
| 13 | Ground Balls | 15 |
| 5 | Strikeouts | 4 |
| 5 | Runs Batted In | 3 |
| 0 | Sacrifice Hit | 0 |
| 10 | Hits | 7 |
| 1 | Stolen Bases | 1 |
| 2 | Walks | 0 |
| 0 | Catcher Interference | 0 |
| 5 | Runs | 3 |
| 2 | Ground Into Double Play | 0 |
| 1 | Sacrifice Flies | 0 |
| 34 | At Bats | 34 |
| 2 | Home Runs | 2 |
| 0 | Grand Slam Home Runs | 0 |
| 12 | Runners Left On Base | 4 |
| 0 | Triples | 0 |
| 1 | Game Winning RBIs | 0 |
| 0 | Intentional Walks | 0 |
| 0 | Doubles | 0 |
| 17 | Fly Balls | 15 |
| 0 | Caught Stealing | 0 |
| 157 | Pitches | 131 |
| 0 | Games Started | 0 |
| 0 | Pinch At Bats | 0 |
| 0 | Pinch Hits | 0 |
| 0.0 | Player Rating | 0.0 |
| 1 | Is Qualified | 1 |
| 1 | Is Qualified In Steals | 1 |
| 16 | Total Bases | 13 |
| 38 | Plate Appearances | 34 |
| 324.0 | Projected Home Runs | 324.0 |
| 2 | Extra Base Hits | 2 |
| 5.2 | Runs Created | 2.8 |
| .294 | Batting Average | .206 |
| .000 | Pinch Hit Average | .000 |
| .471 | Slugging Percentage | .382 |
| .265 | Secondary Average | .206 |
| .342 | On Base Percentage | .206 |
| .813 | OBP Pct + SLG Pct | .588 |
| 0.8 | Ground To Fly Ball Ratio | 1.0 |
| 5.2 | Runs Created Per 27 Outs | 2.8 |
| 37.0 | Batter Rating | 26.0 |
| 17.0 | At Bats Per Home Run | 17.0 |
| 1.00 | Stolen Base Percentage | 1.00 |
| 4.13 | Pitches Per Plate Appearance | 3.85 |
| .176 | Isolated Power | .176 |
| 0.40 | Walk To Strikeout Ratio | 0.00 |
| .053 | Walks Per Plate Appearance | .000 |
| -.029 | Secondary Average Minus Batting Average | .000 |
| 10.0 | Runs Produced | 6.0 |
| 1.0 | Runs Ratio | 1.0 |
| 0.5 | Patience Ratio | 0.4 |
| 0.3 | Balls In Play Average | 0.2 |
| 89.0 | MLB Rating | 77.5 |
| 0.0 | Offensive Wins Above Replacement | 0.0 |
| 0.0 | Wins Above Replacement | 0.0 |
Game Information

Location: San Francisco, California
Attendance: 30,064 | Capacity:
2024 American League East Standings
| TEAM | W | L | PCT | GB | STRK |
|---|---|---|---|---|---|
 New York New York |
- | 68 | W1 | 0.5802469 | 94 |
 Baltimore Baltimore |
3 | 71 | W3 | 0.5617284 | 91 |
 Boston Boston |
13 | 81 | W1 | 0.5 | 81 |
 Tampa Bay Tampa Bay |
14 | 82 | L1 | 0.49382716 | 80 |
 Toronto Toronto |
20 | 88 | L3 | 0.45679012 | 74 |
2024 National League West Standings
| TEAM | W | L | PCT | GB | STRK |
|---|---|---|---|---|---|
 Los Angeles Los Angeles |
- | 64 | W5 | 0.60493827 | 98 |
 San Diego San Diego |
5 | 69 | L1 | 0.5740741 | 93 |
 Arizona Arizona |
9 | 73 | W1 | 0.5493827 | 89 |
 San Francisco San Francisco |
18 | 82 | L1 | 0.49382716 | 80 |
 Colorado Colorado |
37 | 101 | L3 | 0.37654322 | 61 |