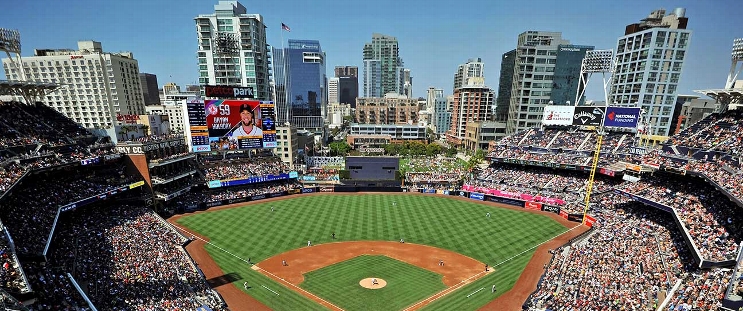
Atlanta Braves at San Diego Padres
· Major League Baseball
6 - 3

d'Arnaud hits two homers, drives in 4 runs in Atlanta 6-3 win over San Diego
"He had a big day," Braves manager Brian Snitker said of d'Arnaud, who also had his third stolen base in his 12-year major league career.
Of Sale, Snitker added: "Talking to him, he was good with just going the five, which I think worked out pretty good. I am really glad we hung on and got him the win."
Atlanta has won six of its last nine games and took two of three from San Diego, which ended the first half by losing six of its last seven.
“We faced some pretty good pitching,” Padres manager Mike Shildt said of the Braves. “That's a good opportunity for us, and I thought our at-bats were good again.”
The Braves finished the first half 53-42 and in second place in the NL East, nine games behind the Philadelphia Phillies.
“We have done a good job of riding this thing out and staying relevant. I like where we are," Snitker said. “Under the circumstances we have done a really good job of battling through the adversities and hanging in there. ... I still think our best baseball is ahead of us.”
The Padres concluded the first half 50-49 and tied for second place in the NL West with the Arizona Diamondbacks. Both teams trail the Dodgers by seven games.
Sale (13-3), an All-Star, gave up one run and four hits. He has won five of his last six starts.
“We had a great series here this weekend. Hopefully we come back after the break and take some days off and regenerate,” Sale said. “I kind of noticed their (Padres) approach. They were not waiting for anything. It seemed like they were very aggressive early in the count.”
San Diego starter Randy Vásquez (2-5) lasted five innings, giving up two runs and four hits.
“I thought overall (Vásquez) was good,” Shildt said. “Just couldn't get to d'Arnaud on a breaking ball.”
D'Arnaud's three-run homer in the sixth off San Diego reliever Stephen Kolek gave Atlanta a 5-1 lead. His solo homer in the eighth off San Diego reliver Jeremiah Estrada was hit in nearly the identical spot in center field to give the Braves a 6-3 lead.
"I knew I barreled them," d'Arnaud said of his homers, which were 445 and 431 feet. “I was able to see the ball really well.”
Pinch-hitter Luis Campusano hit a two-run homer to the opposite field against Braves reliever A.J. Minter in the seventh. Trailing 5-3 in the inning with two outs, the Padres stranded two runners as Manny Machado lined out against reliever Joe Jimenez.
Atlanta closer Raisel Iglesias pitched a scoreless ninth inning for his 22nd save.
The Padres took a short-lived 1-0 lead in the first inning after Xander Bogaerts singled in Donovan Solano from third. Two batters later with runners on second and third base and two outs, Braves third baseman Austin Riley likely saved two runs with a diving snag of a sizzling grounder in the hole to throw Ha-Seong Kim out to end the inning.
“I think that saved the game,” Sale said. “It should have 3-0 right there and that changes the entire landscape of the game, for sure....That was big.”
TRAINER’S ROOM
Braves: RHP Ian Anderson (Tommy John surgery) made his fifth rehab start on July 12, throwing 60 pitches across 4-1/3 innings High-A Rome. Anderson is making his way back from the April 2023 surgery.
Padres: RHP Joe Musgrove (right elbow inflammation) has his first bullpen session scheduled for July 17. He was placed on the 60-day IL in early June.
UP NEXT
Atlanta hosts St. Louis on Friday. The Padres open the second half with an interleague series in Cleveland.
How can I watch Atlanta Braves vs. San Diego Padres?
- TV Channel: Braves at Padres 2022 MLB Baseball, is broadcasted on MLB.tv.
- Online streaming: Sign up for Fubo.
Matchup Prediction
Scoring Summary
 |
9th Inning | Profar lined out to right. |
 |
9th Inning | D. Peralta lined out to center. |
 |
9th Inning | Higashioka struck out swinging. |
 |
9th Inning | Iglesias relieved Jiménez |
 |
9th Inning | Kelenic flied out to right. |
 |
9th Inning | Arcia popped out to second. |
Statistics
 ATL ATL |
 SD SD |
|
|---|---|---|
| 1 | Games Played | 1 |
| 1 | Team Games Played | 1 |
| 0 | Hit By Pitch | 0 |
| 9 | Ground Balls | 12 |
| 10 | Strikeouts | 6 |
| 6 | Runs Batted In | 3 |
| 0 | Sacrifice Hit | 0 |
| 9 | Hits | 8 |
| 2 | Stolen Bases | 1 |
| 2 | Walks | 3 |
| 0 | Catcher Interference | 0 |
| 6 | Runs | 3 |
| 1 | Ground Into Double Play | 1 |
| 0 | Sacrifice Flies | 0 |
| 35 | At Bats | 34 |
| 2 | Home Runs | 1 |
| 0 | Grand Slam Home Runs | 0 |
| 11 | Runners Left On Base | 15 |
| 0 | Triples | 0 |
| 1 | Game Winning RBIs | 0 |
| 0 | Intentional Walks | 0 |
| 1 | Doubles | 0 |
| 16 | Fly Balls | 16 |
| 0 | Caught Stealing | 0 |
| 146 | Pitches | 140 |
| 0 | Games Started | 0 |
| 0 | Pinch At Bats | 1 |
| 0 | Pinch Hits | 1 |
| 0.0 | Player Rating | 0.0 |
| 1 | Is Qualified | 1 |
| 1 | Is Qualified In Steals | 1 |
| 16 | Total Bases | 11 |
| 37 | Plate Appearances | 37 |
| 324.0 | Projected Home Runs | 162.0 |
| 3 | Extra Base Hits | 1 |
| 4.8 | Runs Created | 3.3 |
| .257 | Batting Average | .235 |
| .000 | Pinch Hit Average | 1.000 |
| .457 | Slugging Percentage | .324 |
| .314 | Secondary Average | .206 |
| .297 | On Base Percentage | .297 |
| .754 | OBP Pct + SLG Pct | .621 |
| 0.6 | Ground To Fly Ball Ratio | 0.8 |
| 4.8 | Runs Created Per 27 Outs | 3.3 |
| 43.0 | Batter Rating | 24.0 |
| 17.5 | At Bats Per Home Run | 34.0 |
| 1.00 | Stolen Base Percentage | 1.00 |
| 3.95 | Pitches Per Plate Appearance | 3.78 |
| .200 | Isolated Power | .088 |
| 0.20 | Walk To Strikeout Ratio | 0.50 |
| .054 | Walks Per Plate Appearance | .081 |
| .057 | Secondary Average Minus Batting Average | -.029 |
| 12.0 | Runs Produced | 6.0 |
| 1.0 | Runs Ratio | 1.0 |
| 0.5 | Patience Ratio | 0.4 |
| 0.3 | Balls In Play Average | 0.3 |
| 88.0 | MLB Rating | 77.0 |
| 0.0 | Offensive Wins Above Replacement | 0.0 |
| 0.0 | Wins Above Replacement | 0.0 |
Game Information

Location: San Diego, California
Attendance: 42,132 | Capacity:
2024 National League East Standings
| TEAM | W | L | PCT | GB | STRK |
|---|---|---|---|---|---|
 Philadelphia Philadelphia |
- | 67 | W1 | 0.58641976 | 95 |
 Atlanta Atlanta |
6 | 73 | W1 | 0.5493827 | 89 |
 New York New York |
6 | 73 | L1 | 0.5493827 | 89 |
 Washington Washington |
24 | 91 | L1 | 0.4382716 | 71 |
 Miami Miami |
33 | 100 | W4 | 0.38271606 | 62 |
2024 National League West Standings
| TEAM | W | L | PCT | GB | STRK |
|---|---|---|---|---|---|
 Los Angeles Los Angeles |
- | 64 | W5 | 0.60493827 | 98 |
 San Diego San Diego |
5 | 69 | L1 | 0.5740741 | 93 |
 Arizona Arizona |
9 | 73 | W1 | 0.5493827 | 89 |
 San Francisco San Francisco |
18 | 82 | L1 | 0.49382716 | 80 |
 Colorado Colorado |
37 | 101 | L3 | 0.37654322 | 61 |