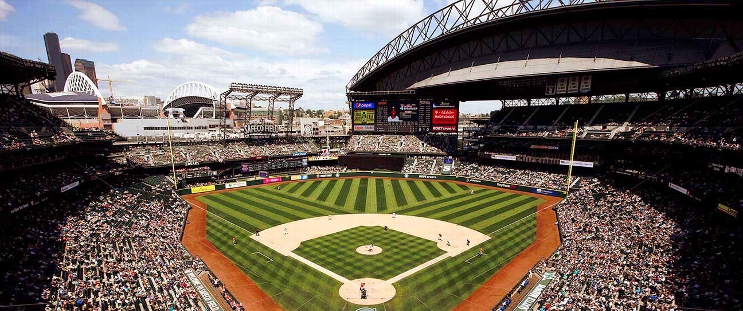
Philadelphia Phillies at Seattle Mariners
· Major League Baseball
5 - 6

Mariners hand Phillies 6th straight loss, overcoming 5-run deficit for 6-5 victory in 10 innings

Seattle handed Philadelphia its sixth straight loss, the longest losing streak for the Phillies since early in the 2023 season when they also dropped six consecutive games.
After Cal Raleigh was intentionally walked to start the inning, Carlos Estévez got Justin Turner and Jason Vosler for the first two outs, before hitting Dylan Moore to load the bases. After falling behind in the count 0-2, Haniger laid off a couple of close pitches and got the benefit of a check-swing that was called a ball. But Estévez (1-4) wasn’t close as the 3-2 pitch missed high and Seattle celebrated its sixth win in the past eight games.
“A win is a win, but hitting in a walk-off feels a little better,” Haniger joked.
It was Haniger’s seventh career walk-off, all with Seattle, tying him with Jim Presley for the most in franchise history.
Haniger drove in the final run and it was his solo home run in the fifth inning that started Seattle’s rally. But it was a four-run sixth inning off All-Star reliever Jeff Hoffman that pulled Seattle even after the Phillies had jumped out to a 5-0 advantage.
Arozarena doubled for the second time in the game and scored on Jorge Polanco’s RBI single to start the rally against Hoffman. Luke Raley entered as a pinch-hitter and lined a two-run double on the first pitch he saw. And Josh Rojas capped the inning with an infield single that scored another run. Bryce Harper dived to keep the ball from reaching the outfield and was able to recover and throw out Raley at the plate with the potential go-ahead run.
Hoffman had been scored on only four times in his 46 previous outings this season and entered the game with a 0.98 ERA.
“Just a little bit off, but he's a guy I trust — still trust. Lefty, righty, it doesn't matter. Just, they were on him tonight,” Phillies manager Rob Thomson said.
Collin Snider (2-1) allowed a leadoff walk but struck out a pair in the top of the 10th to earn the victory. Six Seattle relievers combined to throw 5 2/3 innings, allowing two hits and one run.
"This time of year you have to win games like this. It’s not always pretty, but it’s everybody contributing,” Seattle manager Scott Servais said. “Too many times those guys who pitch in the sixth, seventh inning when you’re down by a couple of runs they kind of get overlooked. They are huge on winning teams.”
Alec Bohm drove in three runs for the Phillies, including a two-out, two-run single in the fifth inning. Brandon Marsh followed with another two-run single as the Phillies scored four times in the frame and knocked out Seattle starter Bryce Miller.
Miller lasted 4 1/3 innings and was forced to work by the Phillies lineup — including a 12-pitch battle that Harper won with a double in the fourth inning to snap an 0 for 24 skid. Miller needed 84 pitches to record 13 outs and failed to make it through the fifth for only the third time in 22 starts.
Philadelphia’s Kolby Allard followed Orion Kerkering as the opener and shut down a Seattle offense that had scored six runs or more in six of the previous seven games. Allard threw four innings, allowing only two hits and striking out four. Haniger’s homer was the only run Allard allowed.
UP NEXT
Phillies: RHP Zack Wheeler (10-5, 2.94) allowed seven earned runs over five innings in his last start against the Mets. Wheeler allowed six earned runs in his five previous starts combined before that.
Mariners: RHP Logan Gilbert (6-7, 3.11) looks to rebound after giving up seven runs in just 2 2/3 innings in his last start against Boston.
How can I watch Philadelphia Phillies vs. Seattle Mariners?
- TV Channel: Phillies at Mariners 2022 MLB Baseball, is broadcasted on MLBN.
- Online streaming: Sign up for Fubo.
Matchup Prediction
Scoring Summary
 |
10th Inning | Haniger walked, Arozarena scored, Moore to second, Raleigh to third. |
 |
10th Inning | Moore hit by pitch, Raleigh to second, Arozarena to third. |
 |
10th Inning | Vosler struck out swinging. |
 |
10th Inning | Vosler hit for Rivas |
 |
10th Inning | Turner flied out to left. |
 |
10th Inning | Raleigh intentionally walked. |
Statistics
 PHI PHI |
 SEA SEA |
|
|---|---|---|
| 1 | Games Played | 1 |
| 1 | Team Games Played | 1 |
| 1 | Hit By Pitch | 3 |
| 13 | Ground Balls | 10 |
| 12 | Strikeouts | 12 |
| 5 | Runs Batted In | 6 |
| 0 | Sacrifice Hit | 0 |
| 8 | Hits | 8 |
| 2 | Stolen Bases | 0 |
| 5 | Walks | 6 |
| 0 | Catcher Interference | 0 |
| 5 | Runs | 6 |
| 0 | Ground Into Double Play | 1 |
| 0 | Sacrifice Flies | 0 |
| 38 | At Bats | 34 |
| 0 | Home Runs | 1 |
| 0 | Grand Slam Home Runs | 0 |
| 28 | Runners Left On Base | 17 |
| 0 | Triples | 0 |
| 0 | Game Winning RBIs | 1 |
| 0 | Intentional Walks | 1 |
| 2 | Doubles | 3 |
| 13 | Fly Balls | 12 |
| 0 | Caught Stealing | 0 |
| 189 | Pitches | 167 |
| 0 | Games Started | 0 |
| 0 | Pinch At Bats | 2 |
| 0 | Pinch Hits | 1 |
| 0.0 | Player Rating | 0.0 |
| 1 | Is Qualified | 1 |
| 1 | Is Qualified In Steals | 0 |
| 10 | Total Bases | 14 |
| 44 | Plate Appearances | 43 |
| 0.0 | Projected Home Runs | 162.0 |
| 2 | Extra Base Hits | 4 |
| 4.0 | Runs Created | 6.0 |
| .211 | Batting Average | .235 |
| .000 | Pinch Hit Average | .500 |
| .263 | Slugging Percentage | .412 |
| .237 | Secondary Average | .353 |
| .318 | On Base Percentage | .395 |
| .581 | OBP Pct + SLG Pct | .807 |
| 1.0 | Ground To Fly Ball Ratio | 0.8 |
| 3.6 | Runs Created Per 27 Outs | 6.0 |
| 34.0 | Batter Rating | 41.0 |
| 0.0 | At Bats Per Home Run | 34.0 |
| 1.00 | Stolen Base Percentage | 0.00 |
| 4.30 | Pitches Per Plate Appearance | 3.88 |
| .053 | Isolated Power | .176 |
| 0.42 | Walk To Strikeout Ratio | 0.50 |
| .114 | Walks Per Plate Appearance | .140 |
| .026 | Secondary Average Minus Batting Average | .118 |
| 10.0 | Runs Produced | 12.0 |
| 1.0 | Runs Ratio | 1.0 |
| 0.4 | Patience Ratio | 0.6 |
| 0.3 | Balls In Play Average | 0.3 |
| 78.5 | MLB Rating | 85.8 |
| 0.0 | Offensive Wins Above Replacement | 0.0 |
| 0.0 | Wins Above Replacement | 0.0 |
Game Information

Location: Seattle, Washington
Attendance: 36,629 | Capacity:
2024 National League East Standings
| TEAM | W | L | PCT | GB | STRK |
|---|---|---|---|---|---|
 Philadelphia Philadelphia |
- | 67 | W1 | 0.58641976 | 95 |
 Atlanta Atlanta |
6 | 73 | W1 | 0.5493827 | 89 |
 New York New York |
6 | 73 | L1 | 0.5493827 | 89 |
 Washington Washington |
24 | 91 | L1 | 0.4382716 | 71 |
 Miami Miami |
33 | 100 | W4 | 0.38271606 | 62 |
2024 American League West Standings
| TEAM | W | L | PCT | GB | STRK |
|---|---|---|---|---|---|
 Houston Houston |
- | 73 | W2 | 0.54658383 | 88 |
 Seattle Seattle |
3.5 | 77 | W4 | 0.52469134 | 85 |
 Texas Texas |
10.5 | 84 | W3 | 0.4814815 | 78 |
 Oakland Oakland |
19.5 | 93 | L3 | 0.42592594 | 69 |
 Los Angeles Los Angeles |
25.5 | 99 | L6 | 0.3888889 | 63 |