
San Francisco Giants at Oakland Athletics
· Major League Baseball
4 - 2

Giants homer twice in the 10th to beat A's 4-2 in Bay Bridge Series finale
Heliot Ramos also connected to help the struggling Giants to their second victory in seven games.
Encarnación lined the first pitch he saw from Dany Jiménez (1-3) over the fence in right-center to snap a 1-all tie. Matt Chapman, the automatic runner at second base, also scored.
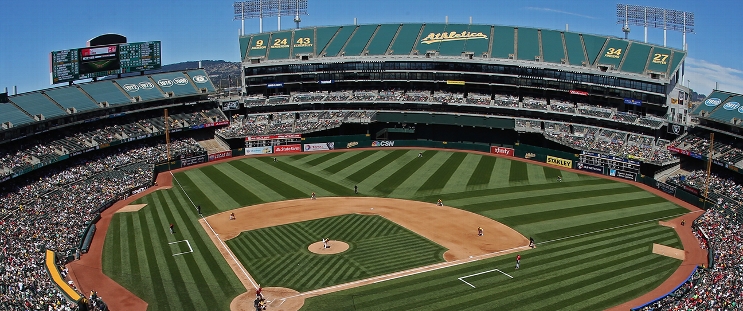
Conforto followed with a pinch-hit drive as a crowd of 32,727 at the Coliseum — many of them wearing Giants colors — roared in approval.
“Don’t you expect a game like this to end this place and the series between the Giants and the A’s?” said Giants manager Bob Melvin, who managed the A’s from 2011-21. “It almost had to happen like that. We were trying to manufacture a run however we could. Didn’t look good for a while but then a couple big swings that we’ve been missing ended up winning the game for us. And they didn’t go quietly.”
Oakland scored an unearned run in the bottom of the 10th and had the bases loaded with no outs. Ryan Walker (8-3), recently elevated to the closer role for the Giants, struck out the next three batters, including Shea Langeliers to end it.
“I feel more calm when (the bases are) juiced,” Walker said. “Once that happened, I wasn’t worried. I just focused on making my pitches.”
When the game was over, Giants third baseman Matt Chapman asked for and received one of the bases used at third. Chapman spent his first five seasons in the majors playing for the A's at the Coliseum.
“That was pretty cool,” Chapman said as he walked through the clubhouse.
The A’s are scheduled to play the next three years in Sacramento before a planned move to Las Vegas for the 2028 season.
The abrupt ending followed a pitching duel between San Francisco ace Blake Snell and Oakland lefty JP Sears.
Nearly three weeks after throwing his first career no-hitter, Snell was dominant in his first start against the A’s since 2021. He allowed six hits and one run to go with 10 strikeouts in seven innings. It was the fourth time in Snell’s last five starts that he reached double digits in strikeouts.
“I’m pitching the ball good, locating the fastball,” said Snell, who has a 1.03 ERA over his last eight starts. “Everything’s starting to come together.”
Sears, the most effective A’s starter over the last six weeks, had nine strikeouts in 7 2/3 innings. He yielded seven hits and one run.
Encarnación and Tyler Fitzgerald each had two hits for the Giants, who were shut out by Oakland 2-0 on Saturday.
“It was a great two days,” Athletics manager Mark Kotsay said. “Both of these games were exciting. It’s a fun way to (end) the Bay Bridge Series, even though we ended up losing.”
Ramos hit his 18th home run leading off the seventh against Sears. The drive traveled an estimated 448 feet and had an exit velocity of 110.5 mph.
The A’s scored their lone run off Snell in the sixth.
Daz Cameron and Brent Rooker singled with one out. Cameron scored on Miguel Andujar’s two-out single just before right fielder Mike Yastrzemski threw out JJ Bleday at third.
TRAINER’S ROOM
Giants: RHP Randy Rodríguez (elbow inflammation) is being shut down for a few weeks, but Melvin is hopeful the reliever will pitch again this season.
Athletics: RHP Austin Adams (forearm tendinitis) was placed on the 15-day injured list and Jiménez was reinstated from the IL.
UP NEXT
Giants: LHP Kyle Harrison (6-5, 4.14 ERA) pitches the series opener against the Chicago White Sox on Monday in San Francisco.
Athletics: RHP Joe Boyle (2-5, 7.39) faces the Tampa Bay Rays on Monday. Boyle has 35 strikeouts in 31 2/3 innings this season.
How can I watch San Francisco Giants vs. Oakland Athletics?
- TV Channel: Giants at Athletics 2022 MLB Baseball, is broadcasted on MLB.TV.
- Online streaming: Sign up for Fubo.
Matchup Prediction
Scoring Summary
 |
10th Inning | Langeliers struck out swinging. |
|
10th Inning | Andujar struck out swinging. |
|
10th Inning | Bleday struck out looking. |
|
10th Inning | Rooker singled to left, Toro to second, Schuemann to third. |
|
10th Inning | Toro walked, Schuemann to second. |
|
10th Inning | Butler scored on error, Schuemann safe at first on fielding error by second baseman Wisely. |
Statistics
 SF SF |
 OAK OAK |
|
|---|---|---|
| 1 | Games Played | 1 |
| 1 | Team Games Played | 1 |
| 1 | Hit By Pitch | 0 |
| 7 | Ground Balls | 9 |
| 15 | Strikeouts | 16 |
| 4 | Runs Batted In | 1 |
| 0 | Sacrifice Hit | 0 |
| 9 | Hits | 8 |
| 0 | Stolen Bases | 0 |
| 0 | Walks | 3 |
| 0 | Catcher Interference | 0 |
| 4 | Runs | 2 |
| 0 | Ground Into Double Play | 0 |
| 0 | Sacrifice Flies | 0 |
| 35 | At Bats | 38 |
| 3 | Home Runs | 0 |
| 0 | Grand Slam Home Runs | 0 |
| 9 | Runners Left On Base | 21 |
| 0 | Triples | 0 |
| 1 | Game Winning RBIs | 0 |
| 0 | Intentional Walks | 0 |
| 1 | Doubles | 0 |
| 13 | Fly Balls | 13 |
| 2 | Caught Stealing | 0 |
| 146 | Pitches | 152 |
| 0 | Games Started | 0 |
| 2 | Pinch At Bats | 1 |
| 1 | Pinch Hits | 0 |
| 0.0 | Player Rating | 0.0 |
| 1 | Is Qualified | 1 |
| 1 | Is Qualified In Steals | 0 |
| 19 | Total Bases | 8 |
| 36 | Plate Appearances | 41 |
| 486.0 | Projected Home Runs | 0.0 |
| 4 | Extra Base Hits | 0 |
| 4.5 | Runs Created | 2.0 |
| .257 | Batting Average | .211 |
| .500 | Pinch Hit Average | .000 |
| .543 | Slugging Percentage | .211 |
| .229 | Secondary Average | .079 |
| .278 | On Base Percentage | .268 |
| .821 | OBP Pct + SLG Pct | .479 |
| 0.5 | Ground To Fly Ball Ratio | 0.7 |
| 4.4 | Runs Created Per 27 Outs | 1.8 |
| 36.0 | Batter Rating | 14.0 |
| 11.7 | At Bats Per Home Run | 0.0 |
| 0.00 | Stolen Base Percentage | 0.00 |
| 4.06 | Pitches Per Plate Appearance | 3.71 |
| .286 | Isolated Power | .000 |
| 0.00 | Walk To Strikeout Ratio | 0.19 |
| .000 | Walks Per Plate Appearance | .073 |
| -.029 | Secondary Average Minus Batting Average | -.132 |
| 8.0 | Runs Produced | 3.0 |
| 1.0 | Runs Ratio | 0.5 |
| 0.6 | Patience Ratio | 0.3 |
| 0.4 | Balls In Play Average | 0.4 |
| 84.5 | MLB Rating | 67.3 |
| 0.0 | Offensive Wins Above Replacement | 0.0 |
| 0.0 | Wins Above Replacement | 0.0 |
Game Information
Location: Oakland, California
Attendance: 32,727 | Capacity:
2024 National League West Standings
| TEAM | W | L | PCT | GB | STRK |
|---|---|---|---|---|---|
 Los Angeles Los Angeles |
- | 62 | W3 | 0.5974026 | 92 |
 San Diego San Diego |
4 | 66 | W2 | 0.5714286 | 88 |
 Arizona Arizona |
6 | 68 | W3 | 0.5584416 | 86 |
 San Francisco San Francisco |
17 | 79 | W1 | 0.48701298 | 75 |
 Colorado Colorado |
33 | 95 | L2 | 0.38311687 | 59 |
2024 American League West Standings
| TEAM | W | L | PCT | GB | STRK |
|---|---|---|---|---|---|
 Houston Houston |
- | 70 | W2 | 0.54545456 | 84 |
 Seattle Seattle |
5 | 75 | W2 | 0.512987 | 79 |
 Texas Texas |
11 | 81 | L2 | 0.47402596 | 73 |
 Oakland Oakland |
17 | 87 | L1 | 0.43506494 | 67 |
 Los Angeles Los Angeles |
22 | 92 | L2 | 0.4025974 | 62 |