
Washington Capitals at Nashville Predators
· National Hockey LeagueOvechkin scores 873rd career goal, Frank gets 1st as Capitals beat Predators 4-1

Tom Wilson and Andrew Mangiapane also scored for the Capitals. Logan Thompson stopped 32 shots as the Capitals won for the second time in three games.
Filip Forsberg scored and Juuse Saros made 12 saves for the Predators, who have lost two straight.
One day after getting an assist in his NHL debut, Frank gathered a stretch pass from Matt Roy at the Nashville blue line and drove down the right side before beating Saros with a wrist shot from the lower part of the right faceoff circle at 8:30 of the third period to put the Capitals up 2-1.
Mangiapane made it 3-1 with 5:06 remaining, and Ovechkin scored career goal No. 873 with an empty-netter with 58 seconds left after blocking a shot and going the length of the ice. Ovechkin is 21 goals shy of tying Wayne Gretzky's NHL career record.
Wilson scored the game’s first goal at 9:03 of the second period.
Forsberg tied it with 3:46 remaining in the second. After going 18 games without scoring, Forsberg has goals in consecutive games.
Predators: Nashville allowed a season-low 16 shots on goal, with Washington beating Saros three times on 15 shots.
WSH wins series 2-0
Scoring Summary
 |
Goal | 2nd Period 9:03 | Tom Wilson Goal (19) Wrist Shot, assists: Dylan Strome (34), Alex Ovechkin (12) |
 |
Goal | 2nd Period 16:14 | Filip Forsberg Goal (11) Wrist Shot, assists: Jonathan Marchessault (17), Roman Josi (20) |
 |
Goal | 3rd Period 8:30 | Ethen Frank Goal (1) Wrist Shot, assists: Matt Roy (9), Martin Fehervary (10) |
 |
Goal | 3rd Period 14:54 | Andrew Mangiapane Goal (10) Backhand, assists: Brandon Duhaime (6), John Carlson (24) |
 |
Goal | 3rd Period 19:01 | Alex Ovechkin Goal (20) Snap Shot, assists: none |
Statistics
 WSH WSH |
 NSH NSH |
|
|---|---|---|
| 27 | Blocked Shots | 15 |
| 12 | Hits | 18 |
| 3 | Takeaways | 2 |
| 16 | Shots | 33 |
| 1 | Power Play Goals | 1 |
| 2 | Power Play Opportunities | 3 |
| 50.0 | Power Play Percentage | 33.3 |
| 0 | Short Handed Goals | 0 |
| 0 | Shootout Goals | 0 |
| 25 | Faceoffs Won | 26 |
| 49.0 | Faceoff Win Percent | 51.0 |
| 13 | Giveaways | 12 |
| 3 | Total Penalties | 2 |
| 6 | Penalty Minutes | 4 |
Game Information
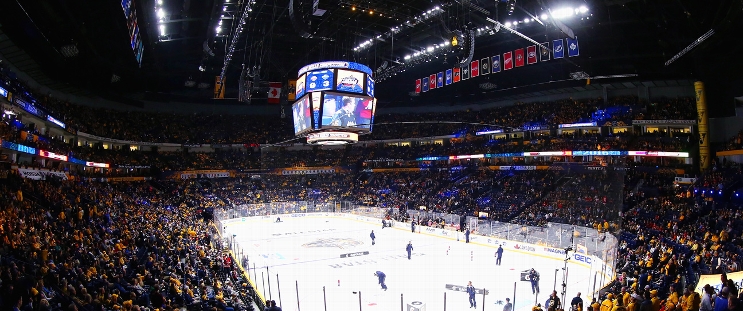 Bridgestone Arena
Location: Nashville, TN
Attendance: 17,159 | Capacity:

Location: Nashville, TN
Attendance: 17,159 | Capacity:
2024-25 Metropolitan Division Standings
| TEAM | W | L | PTS | OTL |
|---|---|---|---|---|
 Washington Washington |
8 | 11 | 84 | 38 |
 Carolina Carolina |
4 | 20 | 70 | 33 |
 New Jersey New Jersey |
6 | 21 | 68 | 31 |
 Columbus Columbus |
8 | 22 | 62 | 27 |
 NY Rangers NY Rangers |
4 | 25 | 58 | 27 |
 NY Islanders NY Islanders |
7 | 23 | 57 | 25 |
 Philadelphia Philadelphia |
7 | 26 | 57 | 25 |
 Pittsburgh Pittsburgh |
9 | 26 | 55 | 23 |


