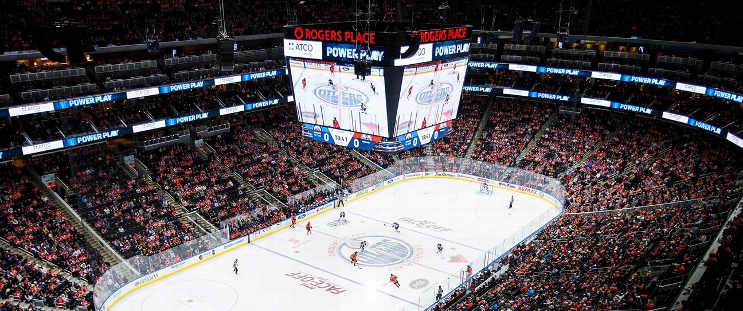
Detroit Red Wings at Edmonton Oilers
· National Hockey LeagueLarkin and Raymond lift Red Wings past Oilers, 3-2 in shootout

Lucas Raymond also scored for the Red Wings in the tiebreaker, while Connor McDavid and Ryan Nugent-Hopkins failed on their chances against Alex Lyon, who made 45 saves in regulation and overtime.
Edmonton took a 2-0 lead in the first period. Leon Draisaitl scored his 36th goal of the season and Jeff Skinner also connected.
Michael Rasmussen scored at 9:59 of the second and Larkin tied it with 8:13 left in the period.
Stuart Skinner stopped 32 shots for the Oilers.
Oilers: Edmonton's winning streak ended at three. The Oilers have won 11 of 15.
Series tied 1-1
Scoring Summary
 |
Goal | 1st Period 6:49 | Leon Draisaitl Goal (36) Snap Shot, assists: Evan Bouchard (30), Connor McDavid (46) |
 |
Goal | 1st Period 10:29 | Jeff Skinner Goal (9) Snap Shot, assists: Zach Hyman (13), Adam Henrique (8) |
 |
Goal | 2nd Period 9:59 | Michael Rasmussen Goal (8) Tip-In, assists: Jonatan Berggren (6), Elmer Soderblom (1) |
 |
Goal | 2nd Period 11:47 | Dylan Larkin Goal (22) Snap Shot, assists: Marco Kasper (10) |
 |
Goal | 5 0:00 | Lucas Raymond Goal Snap Shot |
 |
Goal | 5 0:00 | Dylan Larkin Goal Snap Shot |
Statistics
 DET DET |
 EDM EDM |
|
|---|---|---|
| 19 | Blocked Shots | 17 |
| 23 | Hits | 14 |
| 5 | Takeaways | 8 |
| 35 | Shots | 47 |
| 0 | Power Play Goals | 1 |
| 3 | Power Play Opportunities | 4 |
| 0.0 | Power Play Percentage | 25.0 |
| 0 | Short Handed Goals | 0 |
| 0 | Shootout Goals | 0 |
| 40 | Faceoffs Won | 33 |
| 54.8 | Faceoff Win Percent | 45.2 |
| 19 | Giveaways | 18 |
| 4 | Total Penalties | 3 |
| 8 | Penalty Minutes | 6 |


