
Vegas Golden Knights at Detroit Red Wings
· National Hockey League

Regular Season Series
Series starts 3/16
Statistics
 VGK VGK |
 DET DET |
|
|---|---|---|
| 2.75 | Goals Against Average | 3.10 |
| 26.9 | Shots Against per Game | 29.3 |
| 78.4 | Penalty Kill Percentage | 69.8 |
| 24 | Power Play Goals Against | 39 |
| 0 | Short Handed Goals Against | 0 |
| 3.35 | Goals For per Game | 2.82 |
| 30.4 | Shots per Game | 26.6 |
| 34 | Power Play Goals | 42 |
| 28.1 | Power Play Percentage | 27.3 |
| 5 | Short Handed Goals | 2 |
| 281 | Penalty Minutes | 316 |
 Detroit Red Wings Injuries
| NAME, POS | STATUS | DATE |
|---|---|---|
| J.T. Compher, LW | Day-To-Day | Jan 31 |
| Jeff Petry, D | Injured Reserve | Jan 29 |
| Patrick Kane, RW | Injured Reserve | Jan 29 |
| Vladimir Tarasenko, RW | Day-To-Day | Jan 28 |
| Michael Rasmussen, C | Day-To-Day | Jan 27 |
 Vegas Golden Knights Injuries
| NAME, POS | STATUS | DATE |
|---|---|---|
| Brett Howden, C | Day-To-Day | Jan 24 |
| Cole Schwindt, RW | Injured Reserve | Jan 23 |
| William Karlsson, C | Injured Reserve | Jan 23 |
| Jack Eichel, C | Day-To-Day | Jan 13 |
| Victor Olofsson, RW | Day-To-Day | Jan 5 |
Game Information
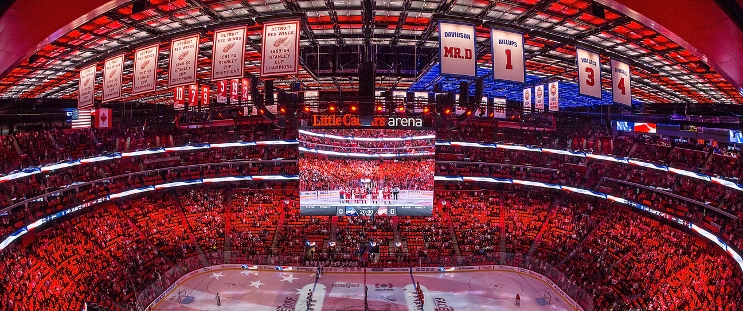 Little Caesars Arena
Location: Detroit, MI
Capacity:
Little Caesars Arena
Location: Detroit, MI
Capacity:


Full Standings


 STL
STL DAL
DAL CBJ
CBJ PHI
PHI