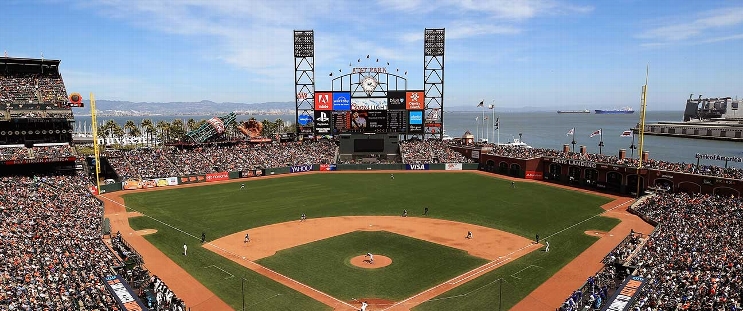
Oakland Athletics at San Francisco Giants
· Major League Baseball
5 - 2

Sears pitches 7 shutout innings, Athletics hit 4 homers in 5-2 win over Giants
The A’s have won eight of 11 since the All-Star break and can win their fifth straight series for the first time since 2021 with a victory on Wednesday.
Brent Rooker and Lawrence Butler stayed hot, hitting their 11th and 10th home runs in July, respectively. The duo also ranks first and second in both home runs and RBI in the majors this month. Daz Cameron and JJ Bleday also went deep. The A’s have hit 45 home runs this month, the most in the majors and second most in Oakland history in July.
“I think you’re just seeing the start of it, and that’s nice,” manager Mark Kotsay said. “I don’t want to say they’re validating themselves. We still have a long season to play and a long way to continue to play good baseball, continue to swing the bats the way we’re swinging it. But as I said pregame, this group is starting to believe in themselves. And that’s powerful when that happens.”
Sears (8-8), the only A’s pitcher to not miss a start this season, rebounded from allowing seven earned runs against the Astros in his last start. Sears struck out a season-high nine and held the Giants to three hits to win his fourth game in a month for the first time in his career.
Kotsay said it was Sears' best outing of the season. The 28-year-old felt he had good command of his fastball on both sides of the plate.
“Coming off not a great ending in my last start, I want to get a good start going into the second half of the season,” Sears said. “I felt really confident.”
Cameron put the A’s up 1-0 in the second with a solo shot, and Butler doubled the lead in the third. Rooker drilled a two-run homer to deep left in the fifth.
The A’s had seven hits off Giants starter Robbie Ray (1-1), who took the loss in his home debut with the Giants. Ray, the 2021 NL Cy Young Award Winner, came off the injured list last week and got the win in his first start against the Dodgers.
Giants manager Bob Melvin said that the adrenaline rush for Ray from his first start may have worn off.
“He went after it so hard in that first game, especially in Dodger Stadium, and he’s probably throwing a little harder too,” Melvin said. “But he won’t make excuses for that.”
Ray said his arm felt good coming into the start.
“Just bad execution tonight,” Ray said. “I felt like a left some pitches over the plate that if I execute them, it’s probably an out. They made me pay for it.”
Patrick Bailey had an RBI single for the Giants in the ninth inning. San Francisco finished with five hits.
ROSTER MOVES
Athletics: The A’s traded RHP Lucas Erceg to the Royals for RHP Will Klein and two minor league players, RHP Mason Barnett and OF Jared Dickey. … They also dealt RHP Paul Blackburn to the New York Mets for RHP Kade Morris, the Mets’ third round selection in 2023. … RHP Gerardo Reyes was selected from Triple-A Las Vegas.
Giants: The Giants traded DH Jorge Soler and RHP Luke Jackson to the Atlanta Braves for LHP Tyler Matzek and minor league IF Sabin Ceballos. … RHP Alex Cobb was dealt to the Cleveland Guardians for LHP Jacob Bresnahan and a player to be named later. … The Giants also acquired utility player Mark Canha from the Detroit Tigers for RHP Eric Silva. … IF Marco Luciano and C Blake Sabol were recalled from Triple-A Sacramento.
UP NEXT
RHP Logan Webb (7-8, 3.72 ERA) is scheduled to pitch for the Giants against RHP Ross Stripling (2-9, 6.02 ERA) on Wednesday.
How can I watch Oakland Athletics vs. San Francisco Giants?
- TV Channel: Athletics at Giants 2022 MLB Baseball, is broadcasted on NBC Sports BA.
- Online streaming: Sign up for Fubo.
Matchup Prediction
Scoring Summary
 |
9th Inning | Wade Jr. struck out swinging. |
 |
9th Inning | Wade Jr. hit for Luciano |
 |
9th Inning | Bailey singled to right, Chapman scored. |
 |
9th Inning | Chapman to second on fielder's indifference. |
 |
9th Inning | Chapman grounded into fielder's choice to third, Conforto out at second. |
 |
9th Inning | Conforto walked. |
Statistics
 OAK OAK |
 SF SF |
|
|---|---|---|
| 1 | Games Played | 1 |
| 1 | Team Games Played | 1 |
| 1 | Hit By Pitch | 0 |
| 15 | Ground Balls | 7 |
| 7 | Strikeouts | 12 |
| 5 | Runs Batted In | 2 |
| 0 | Sacrifice Hit | 0 |
| 10 | Hits | 5 |
| 0 | Stolen Bases | 0 |
| 3 | Walks | 3 |
| 0 | Catcher Interference | 0 |
| 5 | Runs | 2 |
| 0 | Ground Into Double Play | 1 |
| 0 | Sacrifice Flies | 0 |
| 34 | At Bats | 30 |
| 4 | Home Runs | 0 |
| 0 | Grand Slam Home Runs | 0 |
| 13 | Runners Left On Base | 11 |
| 0 | Triples | 0 |
| 1 | Game Winning RBIs | 0 |
| 0 | Intentional Walks | 0 |
| 1 | Doubles | 2 |
| 12 | Fly Balls | 11 |
| 3 | Caught Stealing | 1 |
| 163 | Pitches | 135 |
| 0 | Games Started | 0 |
| 2 | Pinch At Bats | 2 |
| 0 | Pinch Hits | 0 |
| 0.0 | Player Rating | 0.0 |
| 1 | Is Qualified | 1 |
| 1 | Is Qualified In Steals | 1 |
| 23 | Total Bases | 7 |
| 38 | Plate Appearances | 33 |
| 648.0 | Projected Home Runs | 0.0 |
| 5 | Extra Base Hits | 2 |
| 7.0 | Runs Created | 0.8 |
| .294 | Batting Average | .167 |
| .000 | Pinch Hit Average | .000 |
| .676 | Slugging Percentage | .233 |
| .382 | Secondary Average | .133 |
| .368 | On Base Percentage | .242 |
| 1.045 | OBP Pct + SLG Pct | .476 |
| 1.3 | Ground To Fly Ball Ratio | 0.6 |
| 7.0 | Runs Created Per 27 Outs | 0.8 |
| 44.0 | Batter Rating | 17.0 |
| 8.5 | At Bats Per Home Run | 0.0 |
| 0.00 | Stolen Base Percentage | 0.00 |
| 4.29 | Pitches Per Plate Appearance | 4.09 |
| .382 | Isolated Power | .067 |
| 0.43 | Walk To Strikeout Ratio | 0.25 |
| .079 | Walks Per Plate Appearance | .091 |
| .088 | Secondary Average Minus Batting Average | -.033 |
| 10.0 | Runs Produced | 4.0 |
| 1.0 | Runs Ratio | 1.0 |
| 0.8 | Patience Ratio | 0.3 |
| 0.3 | Balls In Play Average | 0.3 |
| 94.5 | MLB Rating | 66.3 |
| 0.0 | Offensive Wins Above Replacement | 0.0 |
| 0.0 | Wins Above Replacement | 0.0 |
Game Information

Location: San Francisco, California
Attendance: 37,885 | Capacity:
2024 American League West Standings
| TEAM | W | L | PCT | GB | STRK |
|---|---|---|---|---|---|
 Houston Houston |
- | 73 | W2 | 0.54658383 | 88 |
 Seattle Seattle |
3.5 | 77 | W4 | 0.52469134 | 85 |
 Texas Texas |
10.5 | 84 | W3 | 0.4814815 | 78 |
 Oakland Oakland |
19.5 | 93 | L3 | 0.42592594 | 69 |
 Los Angeles Los Angeles |
25.5 | 99 | L6 | 0.3888889 | 63 |
2024 National League West Standings
| TEAM | W | L | PCT | GB | STRK |
|---|---|---|---|---|---|
 Los Angeles Los Angeles |
- | 64 | W5 | 0.60493827 | 98 |
 San Diego San Diego |
5 | 69 | L1 | 0.5740741 | 93 |
 Arizona Arizona |
9 | 73 | W1 | 0.5493827 | 89 |
 San Francisco San Francisco |
18 | 82 | L1 | 0.49382716 | 80 |
 Colorado Colorado |
37 | 101 | L3 | 0.37654322 | 61 |