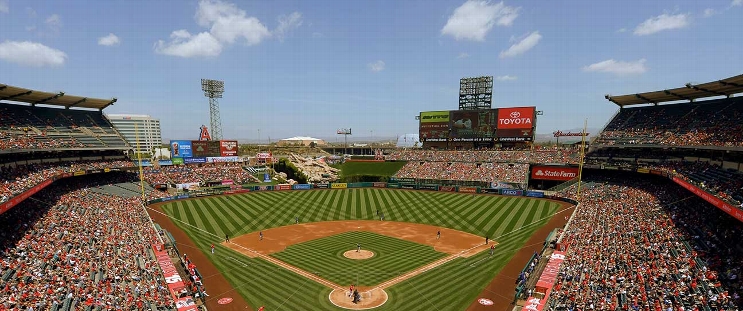
New York Mets at Los Angeles Angels
· Major League Baseball
5 - 1

Pete Alonso homers and newcomer Paul Blackburn strikes out 6 for Mets in 5-1 victory over Angels
Brandon Nimmo went 3 for 5 as everyone in the Mets' lineup had at least one hit. New York has won three of four.
Blackburn (5-2), acquired by the Mets from Oakland on Monday, defeated the Angels for the second time in eight days. The right-hander went six innings and allowed one run on six hits and struck out six.
Mets manager Carlos Mendoza was pleased with Blackburn's outing, especially with the way he was able to mix all his pitches.
“Honestly, I came in today, saw him and told him to be himself and I would talk to him after the game,” Mendoza said.
Blackburn reported to the Mets on Thursday, but didn't begin to meet most of his new teammates until before Friday's game.
Blackburn said the pregame meeting and working with catcher with Francisco Alvarez went better than expected.
“The preparation on his end, constant communication between innings was fun to watch. For the first time out, couldn't have gone better with us,” Blackburn said. "It's been crazy but I'm here to do the job. ... We got the win, that’s all I’m here for really. That’s all I care about”
Nolan Schanuel had two hits and extended his hitting streak to seven games for the Angels, who have dropped six of eight during their homestand. Jo Adell had an RBI single in the second.
“I think we took him for granted," Angels manager Ron Washington said about facing Blackburn. “Tried to do too much with him and took too many big swings instead of trying to keep the line moving. When you have a young offense, that’s what happens.”
With one out in the third inning and Nimmo on first base, Alonso drove a first-pitch cutter from Tyler Anderson (8-10) into the left field stands to give the Mets a 3-1 lead. Alonso is tied for fifth in the National League with 23 homers.
“I felt pretty good at the dish for a long time now. I’m just happy that the balls and line drives are starting to carry over the fence," Alonso said.
Anderson gave up three runs on eight hits in five innings.
The Mets opened the scoring in the second, when Francisco Alvarez's base hit to left-center drove in Jose Iglesias, who led off the inning with a double.
The Angels evened it in the home half when three straight batters reached base. Adell lined a ball that went off Mets third baseman Mark Vientos and into left field as Mickey Moniak scored from second base.
The Mets added a pair in the sixth. J.D. Martinez had an RBI base hit and Francisco Lindor scored when Angels shortstop Zach Neto mishandled Vientos' grounder for an error.
WEB GEM
Luis Guillorme made a diving catch in shallow right field to rob Francisco Alvarez in the fifth inning. Guillorme ran 94 feet to make the play, according to MLB Statcast. Ironically, Guillmore was drafted in the 10th round by the Mets in 2013.
TRAINER'S ROOM
Mets: OF Starling Marte (right knee bone bruise) did some running in the outfield. He will head to the team's spring training complex in Florida on Monday to continue his rehab.
Angels: 3B Luis Rengifo came out after four innings due to irritation to his right wrist. It is the same wrist that caused him to miss 15 games in July.
UP NEXT
Mets LHP David Peterson (5-1, 3.52 ERA) looks to bounce back after suffering his first loss of the season last Sunday at Atlanta. Angels RHP José Soriano (6-7, 3.69 ERA) went 2-2 in five starts during July.
How can I watch New York Mets vs. Los Angeles Angels?
- TV Channel: Mets at Angels 2022 MLB Baseball, is broadcasted on SNY.
- Online streaming: Sign up for Fubo.
Matchup Prediction
Scoring Summary
 |
9th Inning | Moniak struck out swinging. |
 |
9th Inning | Ward lined out to second. |
 |
9th Inning | Calhoun grounded out to second. |
 |
9th Inning | Maton relieved Buttó |
 |
9th Inning | Iglesias at third base. |
 |
9th Inning | McNeil at second base. |
Statistics
 NYM NYM |
 LAA LAA |
|
|---|---|---|
| 1 | Games Played | 1 |
| 1 | Team Games Played | 1 |
| 0 | Hit By Pitch | 1 |
| 15 | Ground Balls | 10 |
| 11 | Strikeouts | 10 |
| 4 | Runs Batted In | 1 |
| 0 | Sacrifice Hit | 0 |
| 13 | Hits | 6 |
| 3 | Stolen Bases | 0 |
| 2 | Walks | 2 |
| 0 | Catcher Interference | 0 |
| 5 | Runs | 1 |
| 0 | Ground Into Double Play | 2 |
| 0 | Sacrifice Flies | 0 |
| 42 | At Bats | 30 |
| 1 | Home Runs | 0 |
| 0 | Grand Slam Home Runs | 0 |
| 29 | Runners Left On Base | 10 |
| 0 | Triples | 0 |
| 1 | Game Winning RBIs | 0 |
| 0 | Intentional Walks | 0 |
| 1 | Doubles | 0 |
| 16 | Fly Balls | 10 |
| 0 | Caught Stealing | 1 |
| 182 | Pitches | 128 |
| 0 | Games Started | 0 |
| 0 | Pinch At Bats | 0 |
| 0 | Pinch Hits | 0 |
| 0.0 | Player Rating | 0.0 |
| 1 | Is Qualified | 1 |
| 1 | Is Qualified In Steals | 1 |
| 17 | Total Bases | 6 |
| 44 | Plate Appearances | 33 |
| 162.0 | Projected Home Runs | 0.0 |
| 2 | Extra Base Hits | 0 |
| 6.4 | Runs Created | 0.6 |
| .310 | Batting Average | .200 |
| .000 | Pinch Hit Average | .000 |
| .405 | Slugging Percentage | .200 |
| .214 | Secondary Average | .033 |
| .341 | On Base Percentage | .273 |
| .746 | OBP Pct + SLG Pct | .473 |
| 0.9 | Ground To Fly Ball Ratio | 1.0 |
| 6.0 | Runs Created Per 27 Outs | 0.6 |
| 39.0 | Batter Rating | 10.0 |
| 42.0 | At Bats Per Home Run | 0.0 |
| 1.00 | Stolen Base Percentage | 0.00 |
| 4.14 | Pitches Per Plate Appearance | 3.88 |
| .095 | Isolated Power | .000 |
| 0.18 | Walk To Strikeout Ratio | 0.20 |
| .045 | Walks Per Plate Appearance | .061 |
| -.095 | Secondary Average Minus Batting Average | -.167 |
| 9.0 | Runs Produced | 2.0 |
| 0.8 | Runs Ratio | 1.0 |
| 0.4 | Patience Ratio | 0.3 |
| 0.4 | Balls In Play Average | 0.3 |
| 89.3 | MLB Rating | 65.0 |
| 0.0 | Offensive Wins Above Replacement | 0.0 |
| 0.0 | Wins Above Replacement | 0.0 |
Game Information

Location: Anaheim, California
Attendance: 37,012 | Capacity:
2024 National League East Standings
| TEAM | W | L | PCT | GB | STRK |
|---|---|---|---|---|---|
 Philadelphia Philadelphia |
- | 67 | W1 | 0.58641976 | 95 |
 Atlanta Atlanta |
6 | 73 | W1 | 0.5493827 | 89 |
 New York New York |
6 | 73 | L1 | 0.5493827 | 89 |
 Washington Washington |
24 | 91 | L1 | 0.4382716 | 71 |
 Miami Miami |
33 | 100 | W4 | 0.38271606 | 62 |
2024 American League West Standings
| TEAM | W | L | PCT | GB | STRK |
|---|---|---|---|---|---|
 Houston Houston |
- | 73 | W2 | 0.54658383 | 88 |
 Seattle Seattle |
3.5 | 77 | W4 | 0.52469134 | 85 |
 Texas Texas |
10.5 | 84 | W3 | 0.4814815 | 78 |
 Oakland Oakland |
19.5 | 93 | L3 | 0.42592594 | 69 |
 Los Angeles Los Angeles |
25.5 | 99 | L6 | 0.3888889 | 63 |