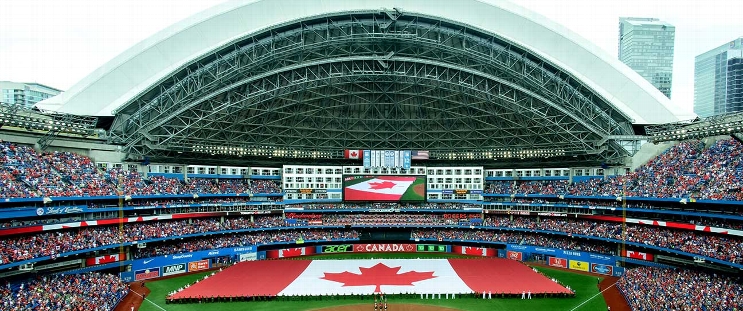
Oakland Athletics at Toronto Blue Jays
· Major League Baseball
8 - 4

Athletics use six-run first inning to beat Blue Jays 8-4, match 2023 win total with 50th victory
Lawrence Butler had three hits, including a pair in the first inning, and drove in a run as Oakland improved to 20-13 since July 2, the third-best record in baseball in that span.
The Athletics are 13-8 since the All-Star break.
“It all comes with confidence and confidence is contagious,” Sears said.
Oakland (50-69) lost 112 games last season and 102 the year before that.
In 2023, the Athletics didn’t earn their 50th win until Sept. 30, the penultimate day of the regular season.
“Last year was brutal at times,” Gelof said. “This year, it’s the same group. We’ve got a few newer guys. I feel like we’re all just on the same page, pulling the same rope. It’s just great to be a part of. I feel like everyone is doing their job and we’re having fun doing it.”
Bleday reached base four times, Gelof had three hits and Brent Rooker added two hits and an RBI. The Athletics have won six of their past eight series.
“They’ve got confidence in that room,” manager Mark Kotsay said. “That group is realizing that they can win baseball games and go out and be competitive, win series for that matter. It’s really nice to watch their success.”
Toronto slugger Vladimir Guerrero Jr. went 0 for 4, ending his hitting streak at 22 games. Guerrero’s streak matched his career high, first set in 2022.
Guerrero scorched a 112.7 mph grounder to shortstop in the first but was thrown out to end the inning. He flew out to right in the fourth and grounded into double plays in the seventh and eighth.
“I thought his swing was a little bit big today,” manager John Schneider said. “It just wasn’t his day.”
Sears (10-8) allowed three runs and three hits, reaching double figures in wins for the first time. He walked three and struck out four.
“It’s great to play behind him,” Gelof said. "He’s always filling up the zone.”
The left-hander retired the first 10 batters in order before Daulton Varsho homered in the fourth.
Varsho’s home run was his 14th. It was Toronto’s first hit since the second inning of Saturday’s 1-0 loss, and its first run since the eighth inning of Friday’s 3-1 win.
Sears was replaced after walking the first two batters in the eighth. Michel Otañez came on and gave up an RBI double to Luis De Los Santos and a two-run single to George Springer. Otañez hit Varsho with a pitch but escaped further damage when Guerrero grounded into a double play on the first pitch.
Oakland’s Mason Miller finished with a 1-2-3 ninth.
The first four batters of the game reached safely against Blue Jays right-hander Chris Bassitt (9-11). Butler doubled and scored on a fielding error before Bleday hit a two-run homer, his 14th. Three batters later, Gelof hit a two-run shot, his 15th. Daz Cameron doubled before Butler capped the inning with an RBI single.
Making his sixth career start against his former team, Bassitt matched a season worst by giving up seven runs in four innings.
ROSTER MOVES
Toronto reinstated LHP Génesis Cabrera from the paternity list and optioned RHP Yerry Rodríguez to Triple-A Buffalo.
UP NEXT
Athletics: Oakland had not named a starter for Tuesday’s interleague game in New York against the Mets. RHP Paul Blackburn (5-2, 3.86) is scheduled for New York.
Blue Jays: RHP Bowden Francis (4-3, 5.44 ERA) is scheduled to face Angels RHP Davis Daniel (1-3, 6.04) on Monday night as Toronto heads west to begin a three-game series at Los Angeles.
How can I watch Oakland Athletics vs. Toronto Blue Jays?
- TV Channel: Athletics at Blue Jays 2022 MLB Baseball, is broadcasted on MLB.TV.
- Online streaming: Sign up for Fubo.
Matchup Prediction
Scoring Summary
 |
9th Inning | Horwitz grounded out to third. |
 |
9th Inning | Clement flied out to left. |
 |
9th Inning | Kirk flied out to right. |
 |
9th Inning | Miller relieved Otanez |
 |
9th Inning | Toro grounded out to second. |
 |
9th Inning | Brown lined out to center. |
Statistics
 OAK OAK |
 TOR TOR |
|
|---|---|---|
| 1 | Games Played | 1 |
| 1 | Team Games Played | 1 |
| 1 | Hit By Pitch | 1 |
| 10 | Ground Balls | 14 |
| 9 | Strikeouts | 5 |
| 7 | Runs Batted In | 4 |
| 0 | Sacrifice Hit | 0 |
| 12 | Hits | 5 |
| 1 | Stolen Bases | 0 |
| 4 | Walks | 3 |
| 0 | Catcher Interference | 0 |
| 8 | Runs | 4 |
| 1 | Ground Into Double Play | 3 |
| 0 | Sacrifice Flies | 0 |
| 36 | At Bats | 29 |
| 2 | Home Runs | 1 |
| 0 | Grand Slam Home Runs | 0 |
| 14 | Runners Left On Base | 7 |
| 0 | Triples | 0 |
| 0 | Game Winning RBIs | 0 |
| 0 | Intentional Walks | 0 |
| 5 | Doubles | 1 |
| 17 | Fly Balls | 10 |
| 1 | Caught Stealing | 0 |
| 173 | Pitches | 113 |
| 0 | Games Started | 0 |
| 0 | Pinch At Bats | 0 |
| 0 | Pinch Hits | 0 |
| 0.0 | Player Rating | 0.0 |
| 1 | Is Qualified | 1 |
| 1 | Is Qualified In Steals | 0 |
| 23 | Total Bases | 9 |
| 41 | Plate Appearances | 33 |
| 324.0 | Projected Home Runs | 162.0 |
| 7 | Extra Base Hits | 2 |
| 8.5 | Runs Created | 1.5 |
| .333 | Batting Average | .172 |
| .000 | Pinch Hit Average | .000 |
| .639 | Slugging Percentage | .310 |
| .417 | Secondary Average | .241 |
| .415 | On Base Percentage | .273 |
| 1.054 | OBP Pct + SLG Pct | .583 |
| 0.6 | Ground To Fly Ball Ratio | 1.4 |
| 8.8 | Runs Created Per 27 Outs | 1.5 |
| 59.0 | Batter Rating | 26.0 |
| 18.0 | At Bats Per Home Run | 29.0 |
| 0.50 | Stolen Base Percentage | 0.00 |
| 4.22 | Pitches Per Plate Appearance | 3.42 |
| .306 | Isolated Power | .138 |
| 0.44 | Walk To Strikeout Ratio | 0.60 |
| .098 | Walks Per Plate Appearance | .091 |
| .083 | Secondary Average Minus Batting Average | .069 |
| 15.0 | Runs Produced | 8.0 |
| 0.9 | Runs Ratio | 1.0 |
| 0.7 | Patience Ratio | 0.4 |
| 0.4 | Balls In Play Average | 0.2 |
| 102.0 | MLB Rating | 74.8 |
| 0.0 | Offensive Wins Above Replacement | 0.0 |
| 0.0 | Wins Above Replacement | 0.0 |
Game Information

Location: Toronto, Ontario
Attendance: 38,797 | Capacity:
2024 American League West Standings
| TEAM | W | L | PCT | GB | STRK |
|---|---|---|---|---|---|
 Houston Houston |
- | 73 | W2 | 0.54658383 | 88 |
 Seattle Seattle |
3.5 | 77 | W4 | 0.52469134 | 85 |
 Texas Texas |
10.5 | 84 | W3 | 0.4814815 | 78 |
 Oakland Oakland |
19.5 | 93 | L3 | 0.42592594 | 69 |
 Los Angeles Los Angeles |
25.5 | 99 | L6 | 0.3888889 | 63 |
2024 American League East Standings
| TEAM | W | L | PCT | GB | STRK |
|---|---|---|---|---|---|
 New York New York |
- | 68 | W1 | 0.5802469 | 94 |
 Baltimore Baltimore |
3 | 71 | W3 | 0.5617284 | 91 |
 Boston Boston |
13 | 81 | W1 | 0.5 | 81 |
 Tampa Bay Tampa Bay |
14 | 82 | L1 | 0.49382716 | 80 |
 Toronto Toronto |
20 | 88 | L3 | 0.45679012 | 74 |