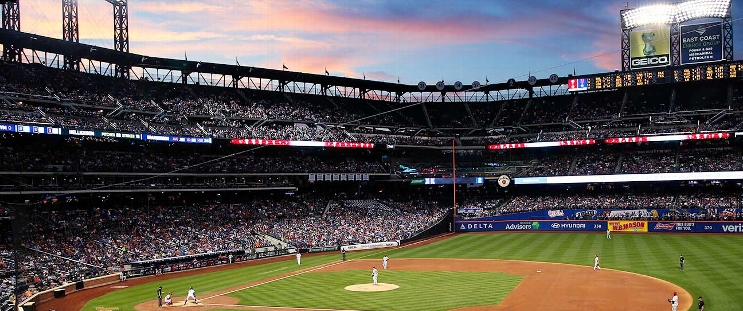
Oakland Athletics at New York Mets
· Major League Baseball
1 - 9

Alonso ends slump with 4 hits as Mets beat A's 9-1 to stop 4-game losing streak
Francisco Lindor had two hits and two RBI while Mark Vientos had a go-ahead, run-scoring double for the Mets, who were outscored 31-5 in their previous four games.
"Today, everybody had a sense of urgency,” Lindor said.
Lindor’s third-inning homer made him the 17th player to hit 100th for the Mets, who had dropped two games behind Atlanta for the last NL wild card.
“It’s cool for sure, it’s great,” Lindor said of his milestone homer. “It’s better because we won today.”
Alonso, eligible for free agency after the World Series. entered in a 9-for-48 slide (.188) since July 30 that had dropped the four-time All-Star’s season average to .240. He homered in the fourth off Joey Estes and capped a six-run seventh with a two-run double against Ross Stripling.
“He can carry a team,” Mets manager Carlos Mendoza said. “Hopefully that’s the case here, where we can get Pete going and carry us for a few weeks, especially where we’re at in the schedule. And it’s contagious — if he gets going, he’s probably going to take some pressure off of the other guys.”
The four-hit game was the seventh of Alonso’s career. He had his lone five-hit game on Aug. 15, 2019, when he was 5-for-6 in a 10-8 win over the Braves.
“I just want to go up there (and) have the best at-bats I can have every single time,” Alonso said. “I’m just happy I was able to come through today for the boys.”
Brandon Nimmo and J.D. Martinez also had RBI in the seventh inning, when Will Klein gave up five runs while getting just one out.
“At that point in that seventh inning, 3-1 game, opportunity to get back in that game if we hold that lead,” Athletics manager Mark Kotsay said. “But unfortunately it didn’t work out.”
David Peterson (7-1) gave up an unearned run and walked four in 6 1/3 innings. He has surrendered two runs or fewer in 10 of 13 starts this season despite averaging 4.3 walks per nine innings.
“Great team win,” Peterson said. “Fun to see the offense come alive, do what we know they can do.”
Daz Cameron had a sacrifice fly for the Athletics.
Estes (5-5) allowed three runs in 5 1/3 innings.
Shea Langeliers walked leading off the second inning and became Oakland’s first player to reach base in 10 consecutive plate appearances since Scott Hatteberg from April 9-11, 2003, according to the Elias Sports Bureau. Langeliers flied out to deep left in the fourth.
Zack Gelof robbed Ben Gamel of a hit in the eighth, when the second baseman ranged into shallow right and made a leaping, lunging, over-the-shoulder catch of Gelof’s blooper. Stripling clapped into his glove several times in acknowledgment.
TRAINER’S ROOM
Athletics: DH/OF Brent Rooker was placed on the paternity list after his wife gave birth to the couple’s second child, daughter Blake Eloise. INF Armando Alvarez was recalled from Triple-A Las Vegas. Alvarez spent three days with the club last week when INF Tyler Nevin was on the paternity list.
Mets: Mendoza said RHP Sean Reid-Foley (right shoulder) feels fine but has paused his rehab for at least a couple days because “the ball is not coming out the way he wants to.” Reid-Foley, on the injured list for the second time this season, has a 13.50 ERA in six rehab appearances. … RHP Dedniel Núñez (right pronator strain) threw his second bullpen Tuesday.
UP NEXT
The three-game series ends Thursday afternoon, when Athletics RHP Mitch Spence (7-8, 4.33 ERA) opposes Mets LHP Jose Quintana (6-8, 4.10).
How can I watch Oakland Athletics vs. New York Mets?
- TV Channel: Athletics at Mets 2022 MLB Baseball, is broadcasted on MLB.TV.
- Online streaming: Sign up for Fubo.
Matchup Prediction
Scoring Summary
 |
9th Inning | Schuemann popped out to first. |
 |
9th Inning | Hernaiz singled to center, Nevin to second. |
 |
9th Inning | Nevin singled to right. |
 |
9th Inning | Gelof grounded out to shortstop. |
 |
9th Inning | Cameron lined out to left. |
 |
9th Inning | Ottavino relieved Young |
Statistics
 OAK OAK |
 NYM NYM |
|
|---|---|---|
| 1 | Games Played | 1 |
| 1 | Team Games Played | 1 |
| 0 | Hit By Pitch | 0 |
| 16 | Ground Balls | 10 |
| 6 | Strikeouts | 4 |
| 1 | Runs Batted In | 8 |
| 0 | Sacrifice Hit | 0 |
| 6 | Hits | 11 |
| 0 | Stolen Bases | 0 |
| 4 | Walks | 3 |
| 0 | Catcher Interference | 0 |
| 1 | Runs | 9 |
| 2 | Ground Into Double Play | 1 |
| 1 | Sacrifice Flies | 1 |
| 31 | At Bats | 33 |
| 0 | Home Runs | 2 |
| 0 | Grand Slam Home Runs | 0 |
| 19 | Runners Left On Base | 9 |
| 0 | Triples | 0 |
| 0 | Game Winning RBIs | 1 |
| 0 | Intentional Walks | 0 |
| 1 | Doubles | 3 |
| 10 | Fly Balls | 20 |
| 0 | Caught Stealing | 0 |
| 125 | Pitches | 147 |
| 0 | Games Started | 0 |
| 1 | Pinch At Bats | 0 |
| 0 | Pinch Hits | 0 |
| 0.0 | Player Rating | 0.0 |
| 1 | Is Qualified | 1 |
| 0 | Is Qualified In Steals | 0 |
| 7 | Total Bases | 20 |
| 36 | Plate Appearances | 37 |
| 0.0 | Projected Home Runs | 324.0 |
| 1 | Extra Base Hits | 5 |
| 1.5 | Runs Created | 7.1 |
| .194 | Batting Average | .333 |
| .000 | Pinch Hit Average | .000 |
| .226 | Slugging Percentage | .606 |
| .161 | Secondary Average | .364 |
| .278 | On Base Percentage | .378 |
| .504 | OBP Pct + SLG Pct | .984 |
| 1.6 | Ground To Fly Ball Ratio | 0.5 |
| 1.5 | Runs Created Per 27 Outs | 8.0 |
| 12.0 | Batter Rating | 57.0 |
| 0.0 | At Bats Per Home Run | 16.5 |
| 0.00 | Stolen Base Percentage | 0.00 |
| 3.47 | Pitches Per Plate Appearance | 3.97 |
| .032 | Isolated Power | .273 |
| 0.67 | Walk To Strikeout Ratio | 0.75 |
| .111 | Walks Per Plate Appearance | .081 |
| -.032 | Secondary Average Minus Batting Average | .030 |
| 2.0 | Runs Produced | 17.0 |
| 1.0 | Runs Ratio | 0.9 |
| 0.3 | Patience Ratio | 0.7 |
| 0.2 | Balls In Play Average | 0.3 |
| 67.5 | MLB Rating | 101.5 |
| 0.0 | Offensive Wins Above Replacement | 0.0 |
| 0.0 | Wins Above Replacement | 0.0 |
Game Information

Location: Queens, New York
Attendance: 28,288 | Capacity:
2024 American League West Standings
| TEAM | W | L | PCT | GB | STRK |
|---|---|---|---|---|---|
 Houston Houston |
- | 73 | W2 | 0.54658383 | 88 |
 Seattle Seattle |
3.5 | 77 | W4 | 0.52469134 | 85 |
 Texas Texas |
10.5 | 84 | W3 | 0.4814815 | 78 |
 Oakland Oakland |
19.5 | 93 | L3 | 0.42592594 | 69 |
 Los Angeles Los Angeles |
25.5 | 99 | L6 | 0.3888889 | 63 |
2024 National League East Standings
| TEAM | W | L | PCT | GB | STRK |
|---|---|---|---|---|---|
 Philadelphia Philadelphia |
- | 67 | W1 | 0.58641976 | 95 |
 Atlanta Atlanta |
6 | 73 | W1 | 0.5493827 | 89 |
 New York New York |
6 | 73 | L1 | 0.5493827 | 89 |
 Washington Washington |
24 | 91 | L1 | 0.4382716 | 71 |
 Miami Miami |
33 | 100 | W4 | 0.38271606 | 62 |