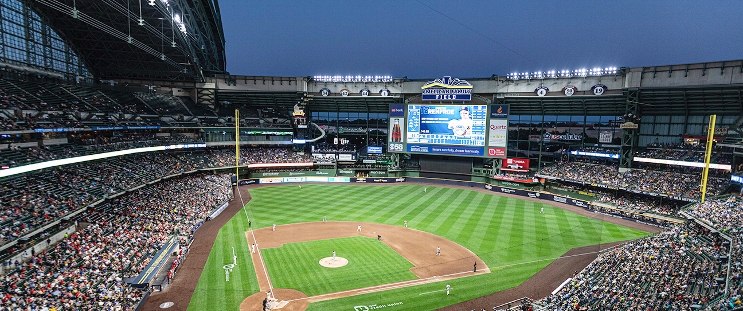
Arizona Diamondbacks at Milwaukee Brewers
· Major League Baseball
7 - 4

Gurriel's tiebreaking homer in sixth inning helps Diamondbacks beat Brewers 7-4
The Diamondbacks moved into sole possession of the NL’s second wild-card spot by taking a one-game lead over the New York Mets, who lost 12-2 to the Philadelphia Phillies. The Atlanta Braves, who lost 4-3 at Miami, are three games behind the Diamondbacks and two games behind the Mets.
“It's a good feeling, but we've got eight more games to go,” Diamondbacks manager Torey Lovullo said. “No deal is done. We've got to go out and play our best baseball from here on out.”
Milwaukee already has clinched the NL Central title.
Arizona’s Ketel Marte hit his 33rd homer – setting a new career high – and also doubled and singled. William Contreras went 4 for 5 with a homer and Garrett Mitchell and Joey Ortiz also went deep for the Brewers.
Milwaukee rallied from a 4-0 deficit by homering off Arizona ace Zac Gallen (13-6) three times in a four-run fifth inning before the Diamondbacks took the lead for good in the sixth.
Gurriel led off the sixth by connecting on a 1-1 pitch from DL Hall (1-2) and hitting it over the wall in left center. Gurriel had been activated from the injured list earlier in the day after recovering from a strained left calf.
“It's always a great thing after the opposite team comes and scores a few runs, if you come back and — boom — hit them back, it will shut down their momentum and actually pick up momentum on our side,” Gurriel said through a translator.
His homer started a three-run rally that culminated with Randal Grichuk drawing a bases-loaded, two-out walk from Jared Koenig. Grichuk took a 3-2 pitch low to bring home Gabriel Moreno.
“You don’t win when you give up seven," Brewers manager Pat Murphy said. “That’s not who we’ve been.”
Rhys Hoskins and Sal Frelick opened the bottom of the sixth with consecutive singles to bring the tying run to the plate, but Kevin Ginkel retired the next three batters to keep the score at 7-4. The Brewers got the tying run to the plate but failed to score again in the seventh.
A.J. Puk worked the ninth for his third save in six opportunities.
The Brewers had gotten back into the game in the fifth by pouncing on Gallen, who hadn’t allowed more than two homers in any of his previous 26 starts this season. He entered Friday having given up a total of two homers over his last 11 starts.
Ortiz hit a one-out drive to left-center that traveled 416 feet. After Brice Turang grounded out, Jackson Chourio beat out an infield single and Contreras followed with a 409-foot homer to center. Mitchell sent Gallen’s next pitch over the wall in left center for a game-tying, 393-foot blast.
It was the first time the Brewers had homered three times in an inning since Rowdy Tellez, Brian Anderson and Mitchell went deep against three-time Cy Young Award winner Max Scherzer in the sixth inning of a 9-0 victory over the New York Mets on April 4, 2023. Gallen hadn’t allowed three homers in a game since a 5-3 loss to Philadelphia Phillies in Game 1 of last year’s NL Championship Series.
Gallen gave up four runs and seven hits in five innings while striking out five and walking one.
Brewers starter Colin Rea gave up three runs and five hits in four innings. He struck out four and walked one.
TRAINER'S ROOM
Gurriel was playing his first game since Sept. 1. The Diamondbacks made room for him by designating INF Luis Guillorme for assignment.
BREWERS' MOVE
The Brewers designated RHP Enoli Paredes for assignment and promoted RHP Kevin Herget from Triple-A Nashville.
UP NEXT
RHP Merrill Kelly (4-0, 4.00 ERA) pitches for the Diamondbacks and RHP Aaron Civale (7-8, 4.48) starts for the Brewers when this four-game series continues Saturday.
How can I watch Arizona Diamondbacks vs. Milwaukee Brewers?
- TV Channel: Diamondbacks at Brewers 2022 MLB Baseball, is broadcasted on MLB.TV.
- Online streaming: Sign up for Fubo.
Matchup Prediction
Scoring Summary
 |
9th Inning | Haase struck out swinging. |
 |
9th Inning | Haase hit for Mitchell |
 |
9th Inning | Contreras reached on infield single to shortstop. |
 |
9th Inning | Chourio struck out swinging. |
 |
9th Inning | Collins struck out swinging. |
 |
9th Inning | Puk relieved Thompson |
Statistics
 ARI ARI |
 MIL MIL |
|
|---|---|---|
| 1 | Games Played | 1 |
| 1 | Team Games Played | 1 |
| 0 | Hit By Pitch | 0 |
| 14 | Ground Balls | 15 |
| 9 | Strikeouts | 11 |
| 7 | Runs Batted In | 4 |
| 0 | Sacrifice Hit | 0 |
| 12 | Hits | 12 |
| 0 | Stolen Bases | 2 |
| 5 | Walks | 1 |
| 0 | Catcher Interference | 0 |
| 7 | Runs | 4 |
| 0 | Ground Into Double Play | 0 |
| 1 | Sacrifice Flies | 0 |
| 37 | At Bats | 39 |
| 2 | Home Runs | 3 |
| 0 | Grand Slam Home Runs | 0 |
| 17 | Runners Left On Base | 18 |
| 0 | Triples | 0 |
| 1 | Game Winning RBIs | 0 |
| 1 | Intentional Walks | 0 |
| 2 | Doubles | 0 |
| 15 | Fly Balls | 13 |
| 1 | Caught Stealing | 0 |
| 171 | Pitches | 157 |
| 0 | Games Started | 0 |
| 0 | Pinch At Bats | 3 |
| 0 | Pinch Hits | 0 |
| 0.0 | Player Rating | 0.0 |
| 1 | Is Qualified | 1 |
| 1 | Is Qualified In Steals | 1 |
| 20 | Total Bases | 21 |
| 43 | Plate Appearances | 40 |
| 324.0 | Projected Home Runs | 486.0 |
| 4 | Extra Base Hits | 3 |
| 7.7 | Runs Created | 7.1 |
| .324 | Batting Average | .308 |
| .000 | Pinch Hit Average | .000 |
| .541 | Slugging Percentage | .538 |
| .324 | Secondary Average | .308 |
| .395 | On Base Percentage | .325 |
| .936 | OBP Pct + SLG Pct | .863 |
| 0.9 | Ground To Fly Ball Ratio | 1.2 |
| 7.7 | Runs Created Per 27 Outs | 7.1 |
| 50.0 | Batter Rating | 39.0 |
| 18.5 | At Bats Per Home Run | 13.0 |
| 0.00 | Stolen Base Percentage | 1.00 |
| 3.98 | Pitches Per Plate Appearance | 3.93 |
| .216 | Isolated Power | .231 |
| 0.56 | Walk To Strikeout Ratio | 0.09 |
| .116 | Walks Per Plate Appearance | .025 |
| .000 | Secondary Average Minus Batting Average | .000 |
| 14.0 | Runs Produced | 8.0 |
| 1.0 | Runs Ratio | 1.0 |
| 0.6 | Patience Ratio | 0.6 |
| 0.4 | Balls In Play Average | 0.4 |
| 97.8 | MLB Rating | 91.3 |
| 0.0 | Offensive Wins Above Replacement | 0.0 |
| 0.0 | Wins Above Replacement | 0.0 |
Game Information

Location: Milwaukee, Wisconsin
Attendance: 32,123 | Capacity:
2024 National League West Standings
| TEAM | W | L | PCT | GB | STRK |
|---|---|---|---|---|---|
 Los Angeles Los Angeles |
- | 64 | W5 | 0.60493827 | 98 |
 San Diego San Diego |
5 | 69 | L1 | 0.5740741 | 93 |
 Arizona Arizona |
9 | 73 | W1 | 0.5493827 | 89 |
 San Francisco San Francisco |
18 | 82 | L1 | 0.49382716 | 80 |
 Colorado Colorado |
37 | 101 | L3 | 0.37654322 | 61 |
2024 National League Central Standings
| TEAM | W | L | PCT | GB | STRK |
|---|---|---|---|---|---|
 Milwaukee Milwaukee |
- | 69 | L1 | 0.5740741 | 93 |
 St. Louis St. Louis |
10 | 79 | W1 | 0.5123457 | 83 |
 Chicago Chicago |
10 | 79 | L1 | 0.5123457 | 83 |
 Cincinnati Cincinnati |
16 | 85 | W1 | 0.47530866 | 77 |
 Pittsburgh Pittsburgh |
17 | 86 | L1 | 0.4691358 | 76 |